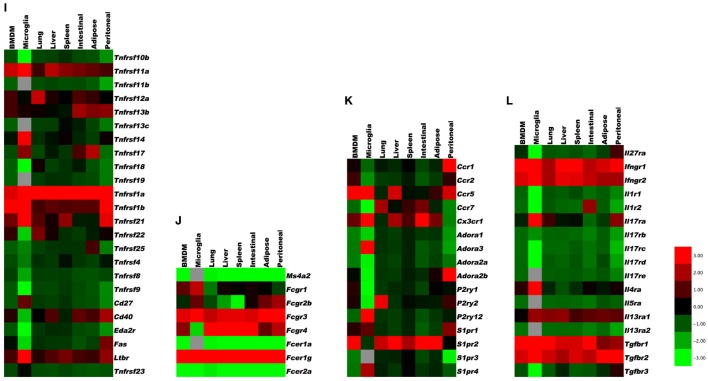
Figure 1.
Gene expression in resident tissue-specific macrophages (microglia, lung, liver, spleen, intestinal, adipose) and bone marrow-derived macrophages (BMDM) for comparison. Heat maps based on hierarchical clustering results from microarray and RNA-Seq data for (A) apoptosis receptors, (B) complement receptors, (C) toll-like receptors, (D) NOD-like receptors, (E) RNA and DNA sensors, (F) C-type lectins, (G) scavenger receptors, (H) integrins, (I) tumor necrosis factor receptor superfamily, (J) Fc receptors, (K) G-protein-coupled receptors, and (L) cytokine receptors. Gene expression levels are expressed in log2 values, differences shown in color scale after Z-score transformation. Colors scale bar ranges from red (+3) to green (−3). Light gray indicates undetectable.


