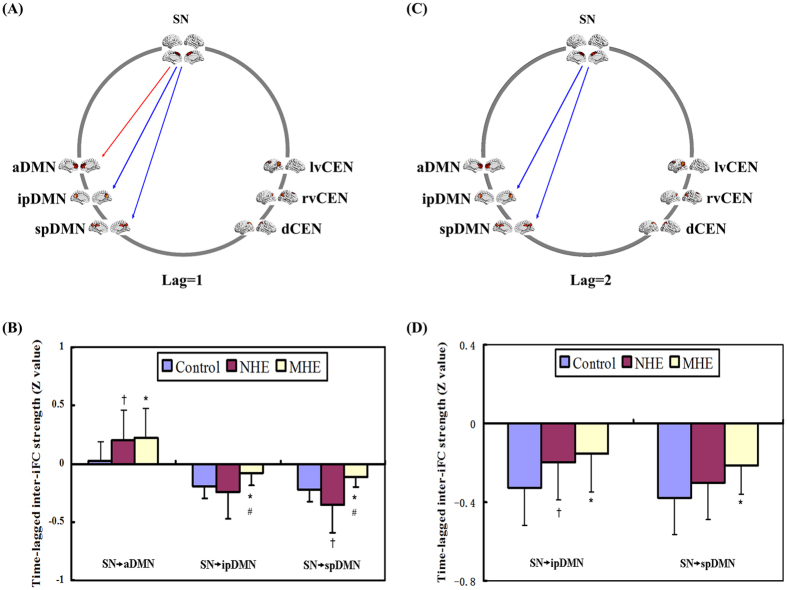
Figure 5. Between-group differences of time-lagged inter-network functional connectivity.
Spatial maps (derived from one-sample t-tests for the control group) indicate the anterior/inferior-posterior/superior-posterior DMN (a/ip/spDMN), left-ventral/right- ventral/dorsal CEN (lv/rv/dCEN), and salience network (SN). (A,C): Red and blue one-way arrows indicate increased positive connectivity and decreased negative connectivity (centered on SN) in MHE patients, respectively. (B,D): The markers *, †, and #indicate significant differences between MHE and HCs, NHE and HCs, and NHE and MHE, respectively.

