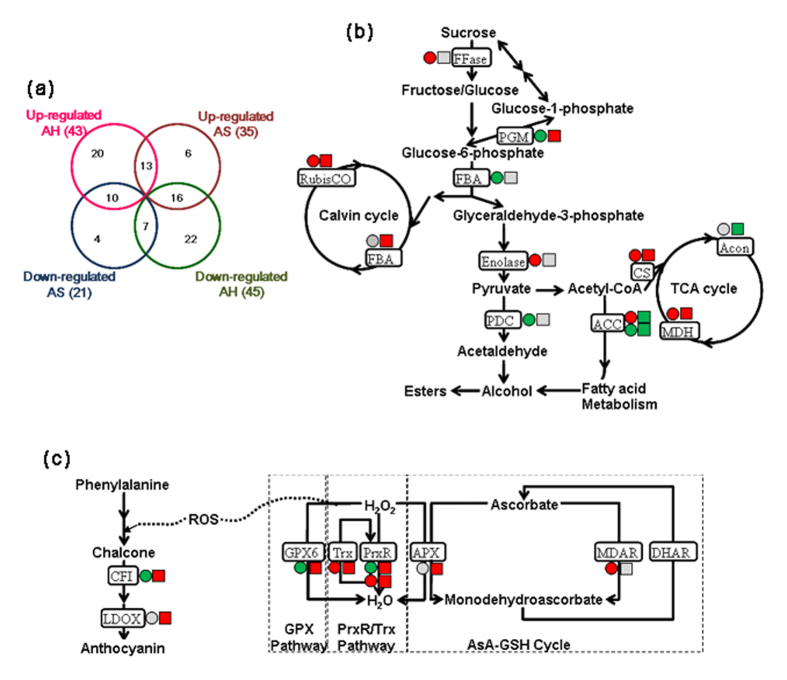
Figure 5.
(a) Venn diagram of the number of identified proteins in the strawberry at harvest (AH) and after storage (AS) in response to CPPU application. Schematic diagram of the primary metabolism (b) and the stress response system (c) of strawberry fruit after preharvest CPPU application. The expression of each protein in the red/magenta and green/blue lines indicated the expression levels of proteins significantly up-regulated and down-regulated by CPPU application, respectively, at harvest (⦁) and after storage (◾). The grey color indicated that the expression level was not significantly regulated, and the color brightness is proportional to the expression ratio.

