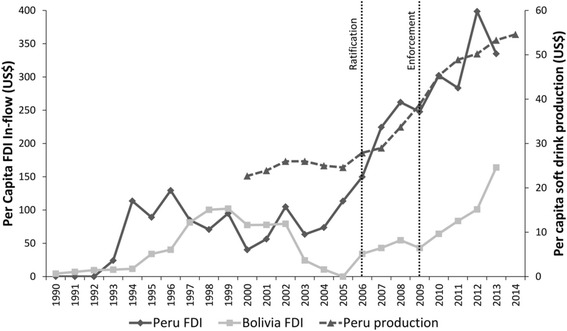
Fig. 2.

Trends in per capita FDI-inflows into Peru and Bolivia, and per capita soft-drink production in Peru, before and after ratification (2006) and enforcement (2009) of the US-Peru FTA. Footnotes: FDI in-flow data in US$ (fixed 2013 exchange rates and prices) from [36, 39]; soft-drink production data in US$ (fixed 2013 exchange rates and prices) from [19]
