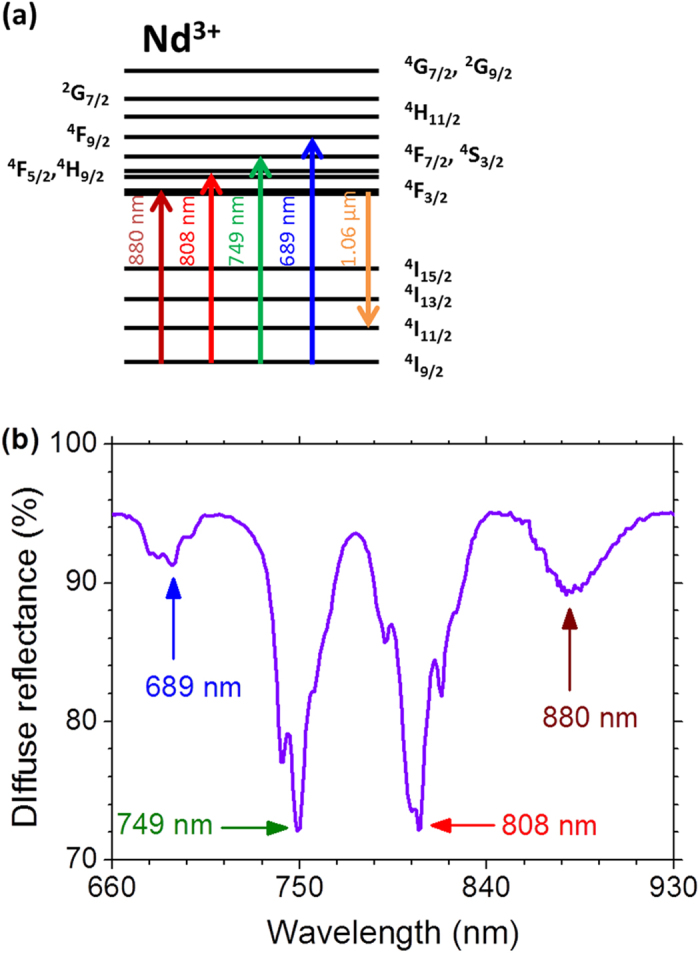
Figure 1. Summary of the Nd3+ random laser operation.

(a) Simplified energy levels diagram of the Nd3+ ions. The upward arrows indicate the excitation wavelengths which correspond to the maximum of the absorption transitions and the downward arrow indicates the random laser transition at 1062 nm. (b) Diffuse reflectance spectrum of the Nd0.10Y0.90Al3(BO3)4 nanocrystals with the Nd3+ absorption transitions labeled by the peak wavelengths indicated in Fig. 1(a).
