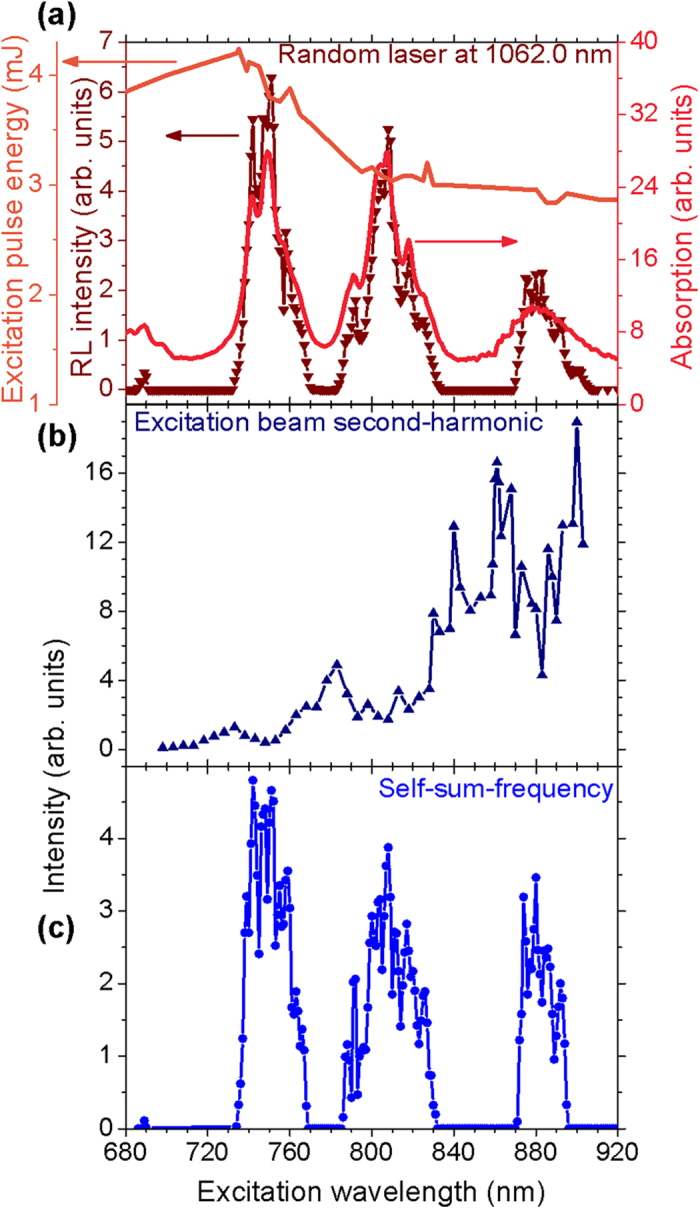
Figure 3. Emitted intensities versus the excitation wavelength.

(a) Excitation spectrum of the random laser (RL) at 1062 nm. The powder absorption and the excitation pulse energy spectra are also presented. Excitation spectra of the second-harmonic of the excitation of the RL (b) and of the self-sum-frequency generation (c) due to the wave-mixing between the RL and the excitation beam. Error bars are not shown in the figure because they are small or does not provide any relevant information for interpretation of the data. The illuminated area of the sample and the pulse duration were 1.2 mm2 and 7 ns, respectively.
