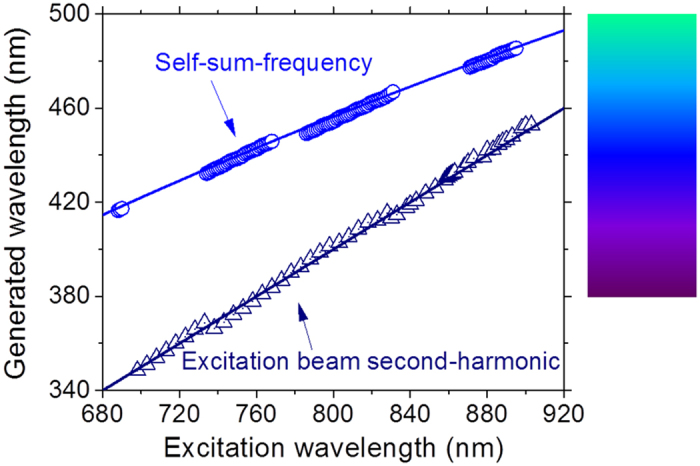
Figure 4. Ultraviolet and blue light wavelengths as a function of the excitation wavelength.

The solid lines connecting the data represent the second-harmonic and the self-sum-frequency generation expected considering the incident and the RL wavelengths. The colored panel shows the color of the generated wavelengths. Error bars are smaller than the symbols representing the measured values.
