
Fig. 2.
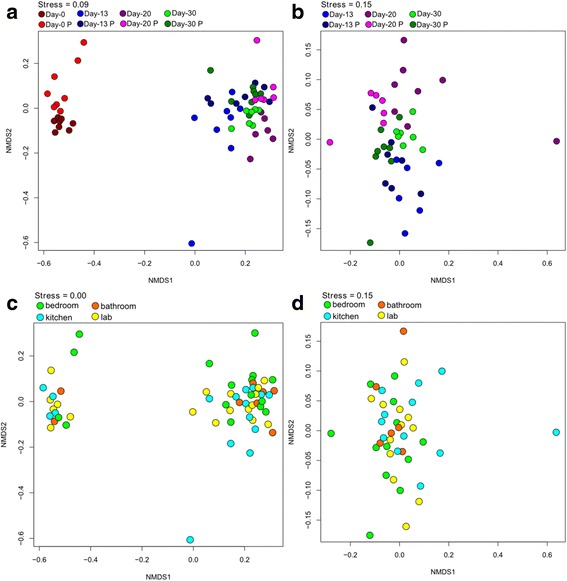
NMDS ordinations based on Bray-Curtis distances between all samples; a NMDS ordination displaying the distance between samples taken at the different time points; b NMDS ordination displaying the distance between samples taken at the different time points excluding D0 samples; c NMDS ordination displaying the distance between samples taken at the different locations; Adonis p-value 0.452, MRPP, significance of delta 0.957, A: –0.02321. d NMDS ordination displaying the distance between samples taken at the different locations excluding D0 samples; Adonis p-value 0.486, MRPP, significance of delta 0.254, A: 0.005762. A suffix “P” after the respective time points indicates that these samples are treated with PMA. a, b Various time points: Adonis p = 0.001 and MRPP significance of delta = 0.001 and A = 0.02813. c, d Various locations: Adonis p value of 0.452, MRPP, significance of delta = 0.957, A = −0.02321. The permanova and MRPP when looking at two different test (being treated with PMA or being not treated with PMA) are Adonis p = 0.034 and MRPP, significance of delta = 0.023, A = 0.01888. The Day 30; Kitchen-4 (see Table 1) sample is a potential outlier but removing this sample from the NMDS permutations did not change the significance values of the different variables but this sample was not included in this figure