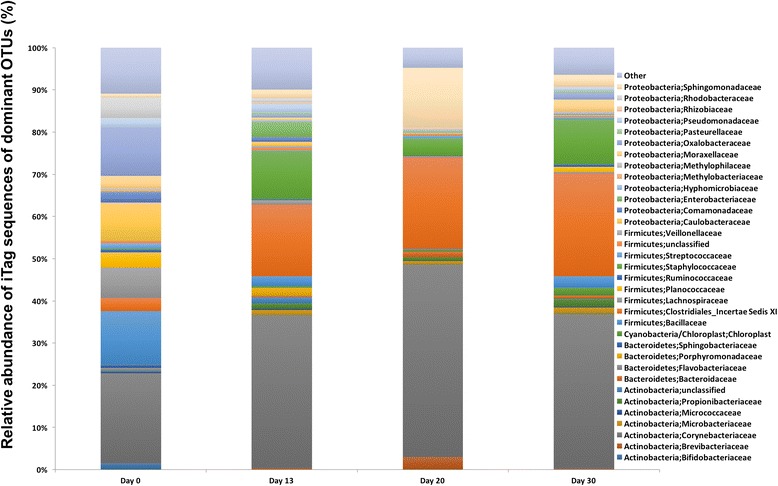
Fig. 4.

Dominant microbial population and microbial succession patterns observed in 30-day occupation period of the ILMAH system. The OTU abundance that are >0.75 % of the total microbial population are computed in this bar graph. Day 0 surfaces show completely different microbial profile when compared to the subsequent sampling days of the crew occupation
