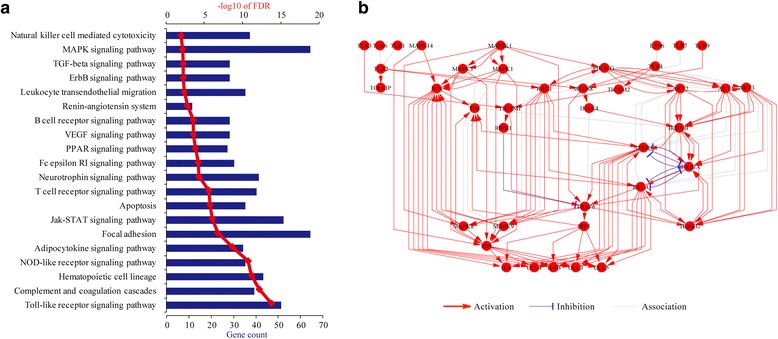
Fig. 3.

Pathway analysis of atherosclerosis-related genes. a Enrichment analysis of pathways. DAVID online tools were used and genes are classified according to the KEGG pathway database. b Visualization of the Toll-like receptor signaling pathway. Nodes represent genes. Edges represent gene dependences derived from KEGG pathway hsa04620. Genes without a direct interaction with others are not included. This graph was generated by using the Cytoscape software
