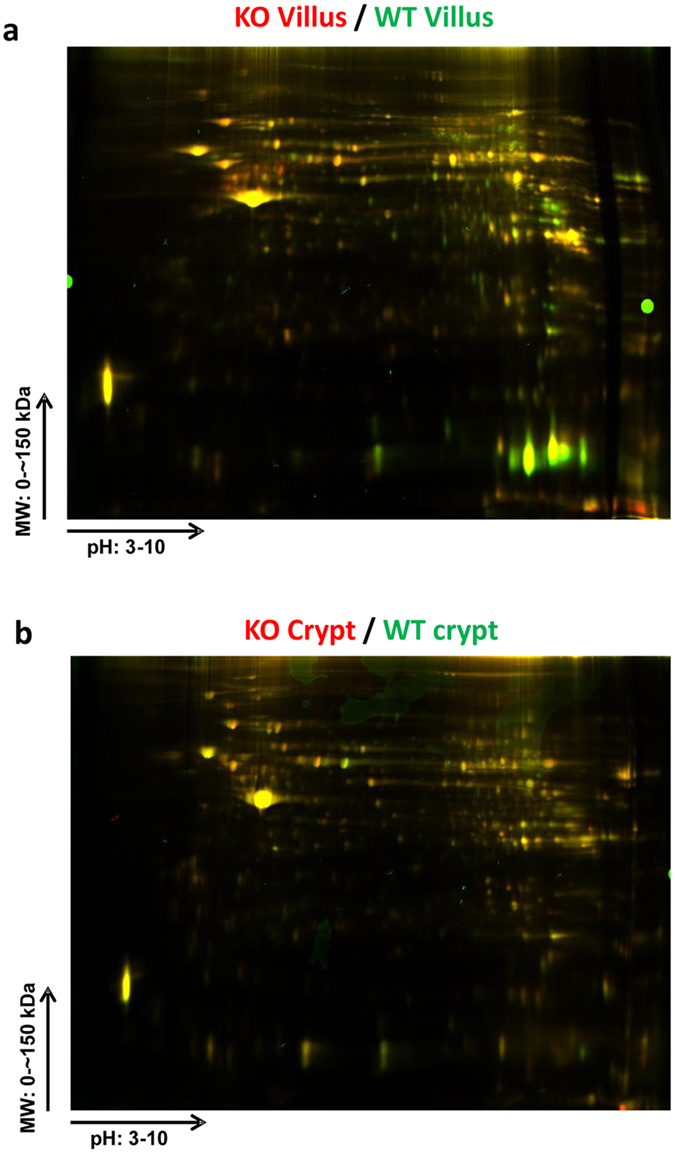
Figure 7. 2D-DIGE-based assessment of differential protein expression.

(a) Superimposed 2D-DIGE overlay image of protein accumulation in the villi of PepT1 KO (Cy5, red fluorescence) and BL-6 WT (Cy3, green fluorescence) mice. (b) Superimposed 2D-DIGE overlay image of protein accumulation in the crypts of PepT1 KO (Cy5, red fluorescence) and BL-6 WT (Cy3, green fluorescence) mice.
