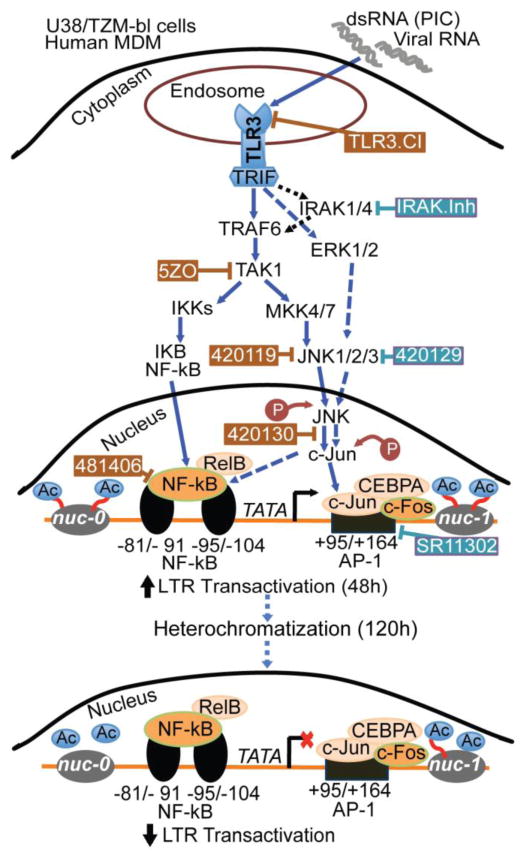
Figure 11. Model illustrating the signaling pathways in TLR3-induced HIV-1 transactivation.
Arrows with solid blue lines indicates activation and potential direct signaling. Dotted blue lines show cross-talk and alternative signaling pathways that may be involved in TLR3-induced HIV-1 transactivation. Dotted black lines show known pathways that do not appear to be involved in TLR3-induced HIV-1 transactivation. The ⊥ symbol indicates pharmacological inhibitors; brown symbol and brown rectangular boxes indicates compounds with inhibitory effects, while blue symbol and blue rectangular boxes indicating compounds with only partial or no inhibitory effects. “Ac” indicates acetylation.
 indicates a decrease.
 indicates an increase.

