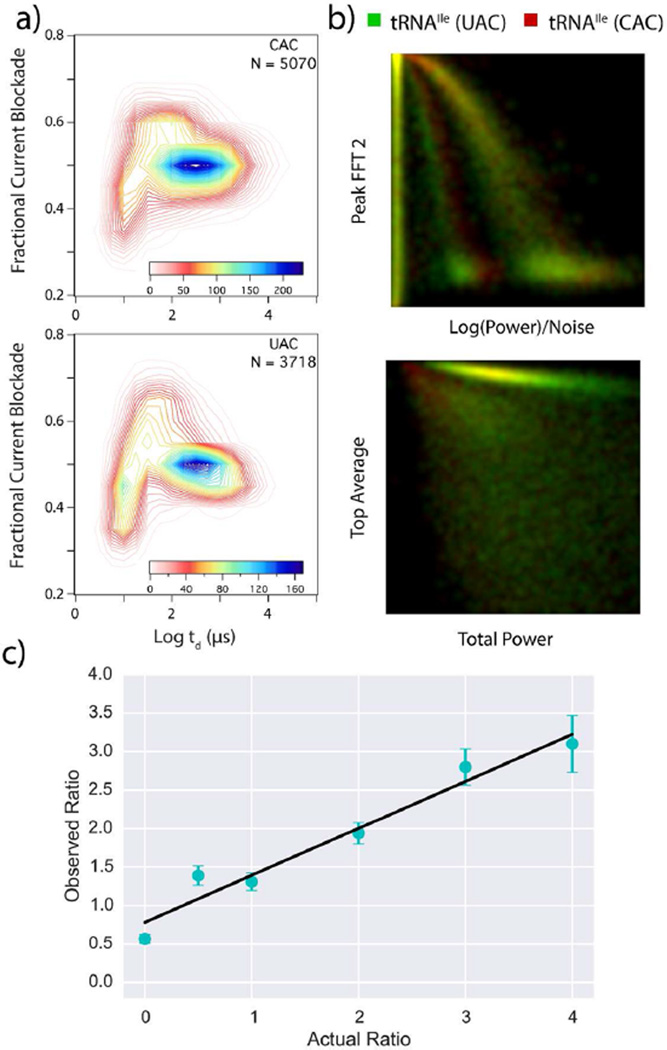
Figure 5.
Comparison of the UAC and CAC tRNAIle isoacceptors. (a) Contour plots showing both isoacceptors, >3000 events were recorded for each at an applied voltage of 500 mV. (b) Two-dimensional projections using four of the SVM features. All units are normalized and shown from 0 to 1. UAC (green) and CAC (red). SVM analysis yields calling accuracy of 93% for individual pulses. Signal feature definitions: peal FFT 2 (power spectrum value at 18 kHz), log(power)/noise (the log of the sum of the power spectrum, divided by the noise spectrum of the nanopore system), top average (sum of the ionic current values within a translocation pulse), total power (log of the sum of the power spectrum) (c) Measured ratio of UAC to CAC signals vs the known molar ratio in solution. The ratios do not show 1:1 correspondence due to differences in the capture efficiency for the two molecules, but the linear correlation convincingly shows that the identity of single molecule events can be assigned). The error in the ratios was determined by segmenting the peaks by time (~5 s intervals). The ratios between the various analytes were then determined for each segment, normalized and the percent error was determined.

