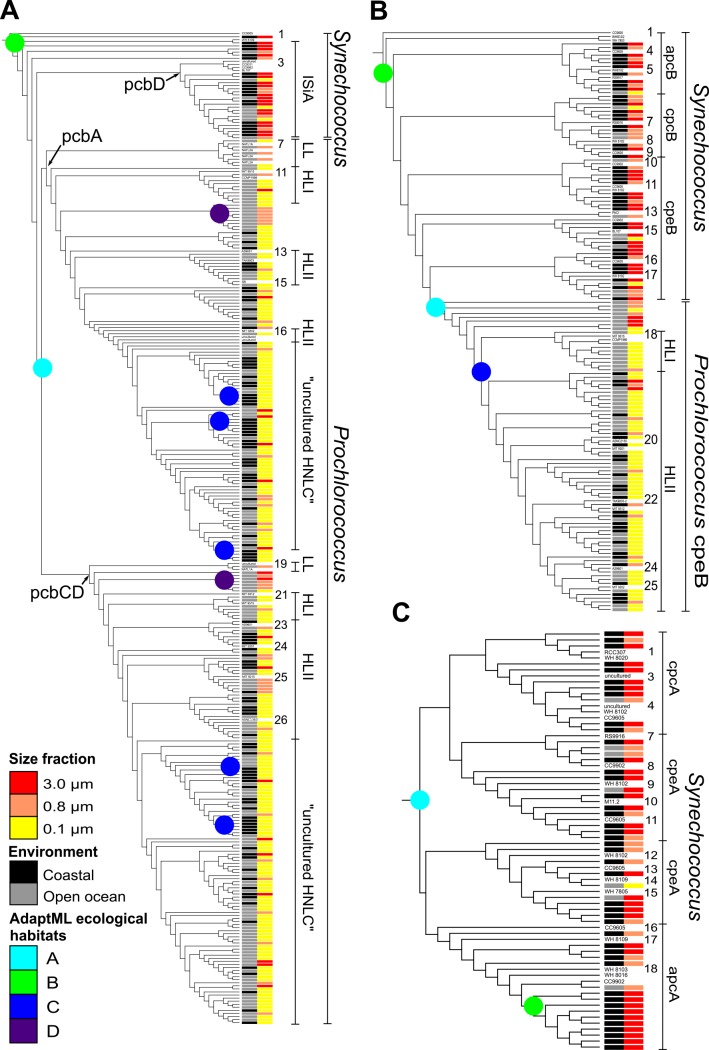
Fig 3. Phylogenetic reconstruction of picocyanobacteria and their habitat distribution along the Indian Ocean transect.
Metagenomic samples from stations GS108, GS110, GS112, GS117 and GS122 were analyzed. Amino acid sequences (longer than 80 amino acids) from Synechococcus and Prochlorococcus were collected from the five stations, and aligned using MUSCLE [31] together with reference sequences taken from GenBank. The phylogenetic tree was inferred by maximum likelihood using PhyML and the VT+Γ model for sequence evolution [33]. AdaptML analysis [34] was used to map their characteristics and habitat predictions. The inferred habitats are identified by colored circles at internal nodes, and labeled A–D. Colored bars indicate Environment (Column no. 1): coastal (black), open ocean (gray), and Size fractions (Column no. 2): 0.1 μm (yellow), 0.8 μm (orange), 3.0 μm (red). (A) Pcb/IsiA, light-harvesting chlorophyll-binding peptides. (B) Light-harvesting phycobilisome ß-subunits (cpe, cpc, apc). (C) Light-harvesting phycobilisome α-subunits (cpe, cpc, apc). Sequences included as references are given in S2 Table, and numbered from 1 and downwards.

