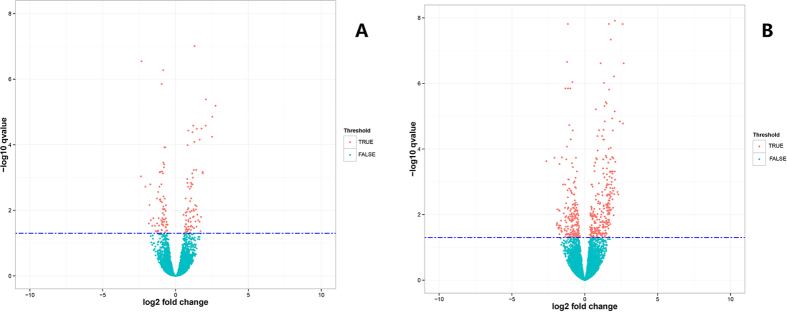
Figure 1. Volcano plot displaying differential expressed genes in bovine mammary tissues within two different comparison groups.
(A) DEGs identified in bovine mammary tissues with high and low milk protein percentage at peak lactation. (B) DEGs identified in bovine mammary tissues with high and low milk protein percentage during the non-lactating period. The y-axis corresponds to the mean expression value of log10 (q-value), and the x-axis displays the log2 fold change value. The red dots represent the significantly differential expressed transcripts (q < 0.05); the blue dots represent the transcripts whose expression levels did not reach statistical significance (q > 0.05).

