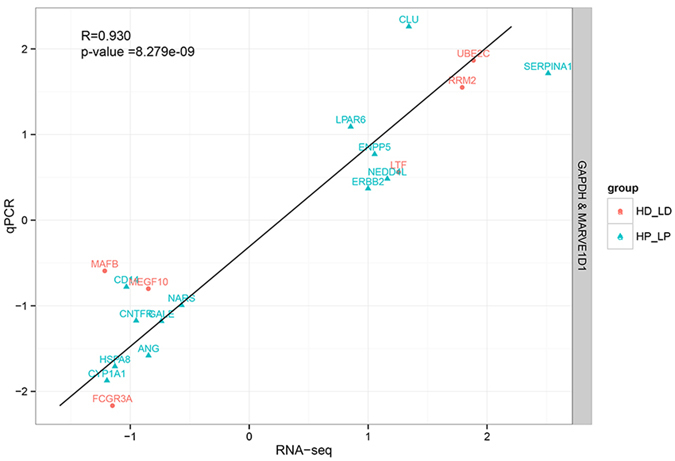
Figure 2. Correlations of mRNA expression level of 19 randomly differentially expressed genes in bovine mammary tissues between high and low milk protein percentage under peak and non-lactating period using RNA-Seq and qRT-PCR.

The x- and y-axis show the log2 (ratio of mRNA levels) measured by RNA-seq and qRT-PCR, respectively. The DEGs marked with blue dots were detected between high and low milk protein percentage at peak lactation (HP vs LP), and the DEGs marked with red dots were identified between high and low milk protein percentage during non-lactating period (HD vs LD).
