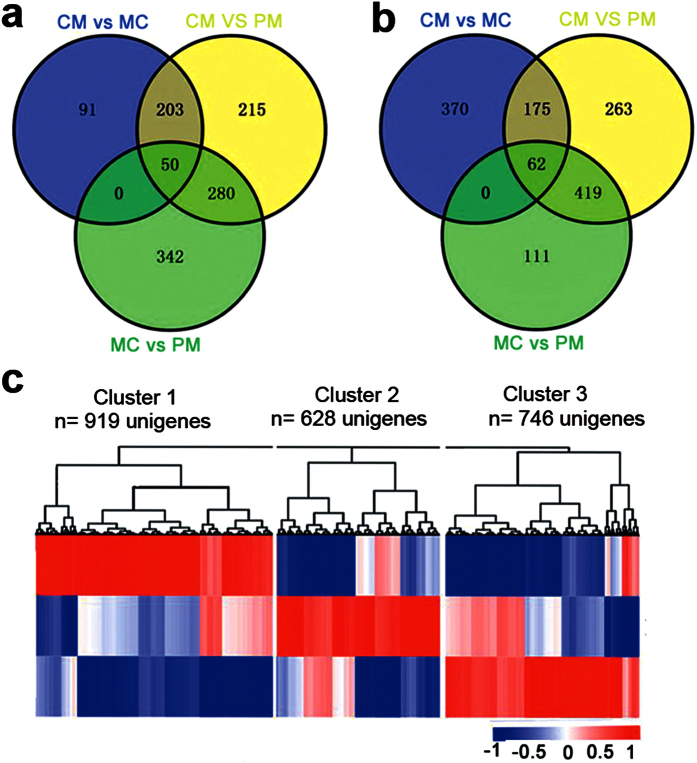
Figure 2. Analysis of differentially expressed unigenes during Microhyla fissipes metamorphosis.
Venn diagrams show the number of genes significantly (a) up-regulated and (b) down-regulated; green, blue and yellow circles represent the changes from PM to MC, MC to CM, and PM to CM, respectively. (c) Similarity of the expression profiles between genes with hierarchical clustering is shown above the heatmap. Intensity of color indicates expression levels, and the three major clusters represent the PM, MC and CM stages.

