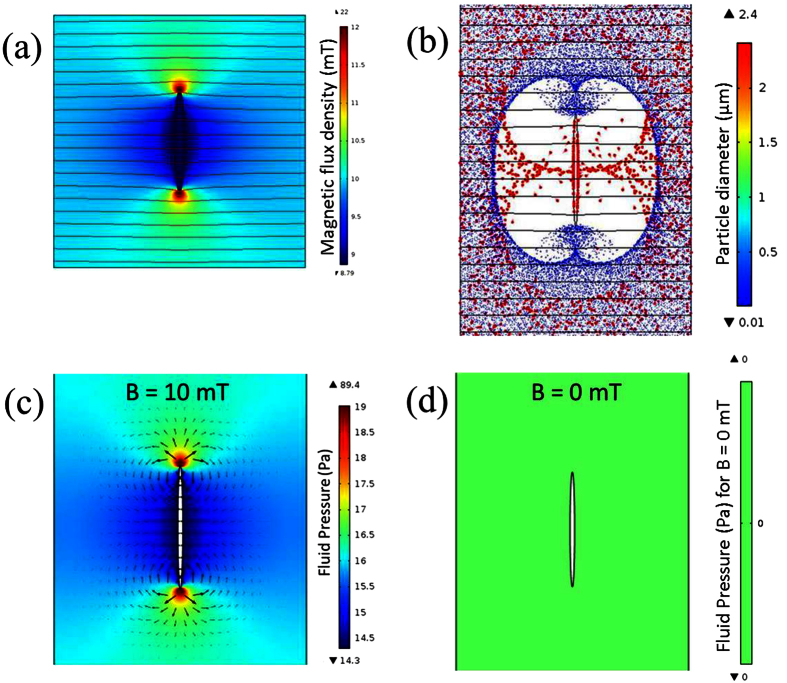
Figure 4.
(a) Simulated distribution of magnetic flux density B [mT] and (b) shows the simulated distribution of MNPs (small dots) and bacteria (large dots) when a magnetic field of 10 mT was applied. Particle sizes are not to scale. The 2D contour plots of the z component of magnetic vector potential Vz [Wb/m] are also shown in (a,b) for an external uniform magnetic flux density of 10 mT, applied from left to right. Figure (c,d) shows the color plotting of simulated fluid pressure distribution due to the magnetic forces applied on ferrofluid with B = 10 mT and 0 mT, respectively, and the arrows in (c) show both the magnitudes (log format) and directions of corresponding magnetic buoyancy forces.

