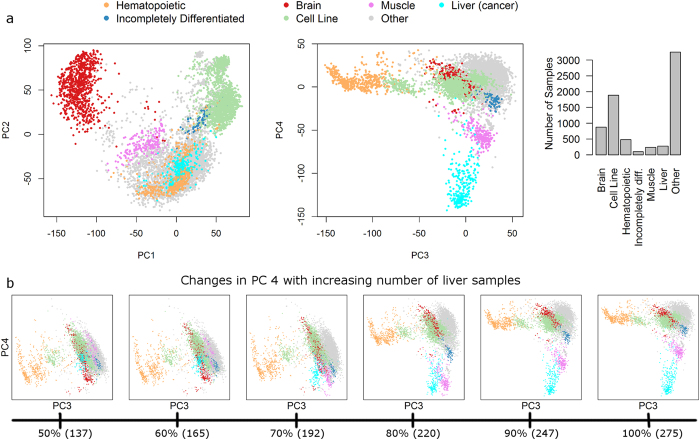
Figure 1. PCA based analysis of the large scale structure in gene expression data.
(a) PCA was applied to the own dataset, replicating the separation of brain tissues, cell lines, and hematopoietic tissues from all others in the first three PCs as reported by Lukk et al., but revealing different orientations of these three PCs. The fourth PC is associated with liver and hepatocellular carcinoma samples, in stark contrast to the noise association reported by Lukk et al. Details of the classification into the 7 color coded groups are given in Supplemental Table S2. The sample distribution among these groups differs (b) Detection of a liver-specific signal in PC 4 depends critically on the number of liver (cancer) samples included in the analyzed dataset. A reduction of the number of liver (cancer) samples to 50 or 60% completely erases any liver-specificity of PC 4. This explains the observed difference in PC 4 between the Lukk dataset and our own dataset, since the proportion of liver (cancer) samples in the Lukk dataset is only 30% of that in the own dataset.

