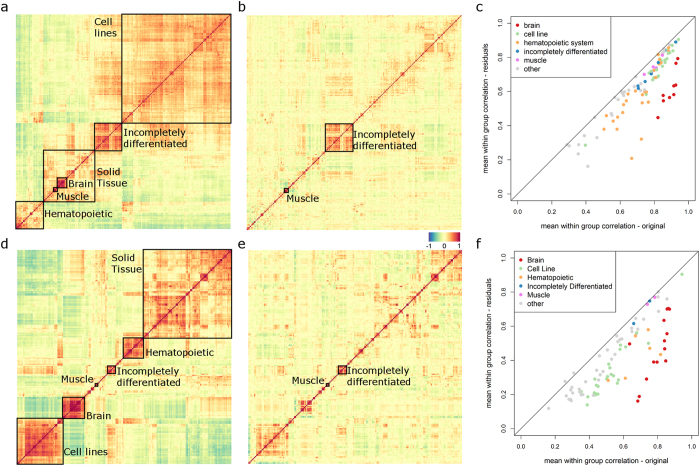
Figure 2. Inter- and intra-tissue correlation before and after PCA-based decomposition.
(a,d) Correlation matrix of the 369 (a) or 192 (d) tissue specific expression patterns derived from the Lukk dataset (a) or the own dataset (d) shows strong correlations between the signatures of the large scale groups (boxes and text). The ordering is based on hierarchical clustering of the columns and rows (euclidean distance, complete linkage). (b,e) Residual tissue specific signatures of the Lukk (b) or own (e) datasets after PCA-based decomposition show strongly reduced correlations between each other. Only very few clusters remain in comparison to (a,d). The ordering of columns and rows in (b,e) is the same as in (a,d) respectively. (c,f) In contrast to the strong reduction of between-signature correlations, correlations between samples of the same group, i.e. within a specific tissue or cell type, remain high. Shown are the mean within-group correlations of all groups that have at least 10 samples before (abscissa) and after (ordinate) PCA-based decomposition. This is a first indication that there is significant tissue specific information in the residual space.

