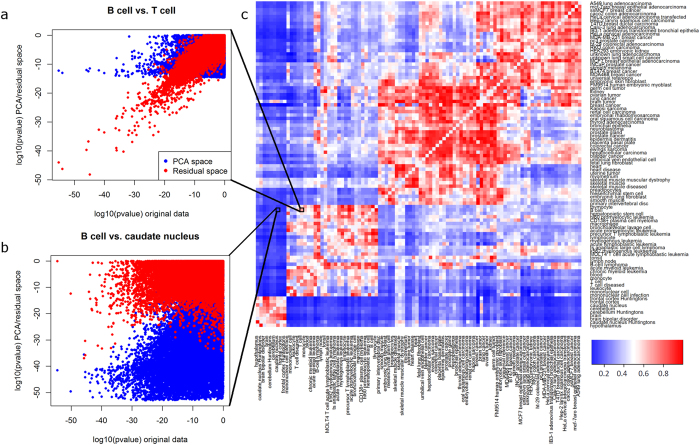
Figure 3. Information content in the PCA-space and the residual space measured by log-10 p-values.
(a,b) The information partition between the projected space and the residual space is shown for 2 different comparisons, validating the high tissue-specific information in the residual space (strongly negative p-values). Blue (red) points depict the log-10 p-value in the projected space (the residual space) in comparison to the log-10 p-value in the original dataset. The corresponding IR values (Schneckener et al.3) of the 2 comparisons are 0.7103 (a), and 0.1641 (b). (c) Heatmap of IR values for all pairwise comparisons of the 96 groups with at least 10 samples in the Lukk dataset. Blue colors correspond to low IR values, indicating that most information is in the PCA space, while red colors correspond to high IR values, meaning that the residual space contains more information than the PCA space. In general, it can be observed that within one of the large scale groups the IR is very high (a,c), while it is rather low for comparisons between tissues from different large scale groups (b,c).

