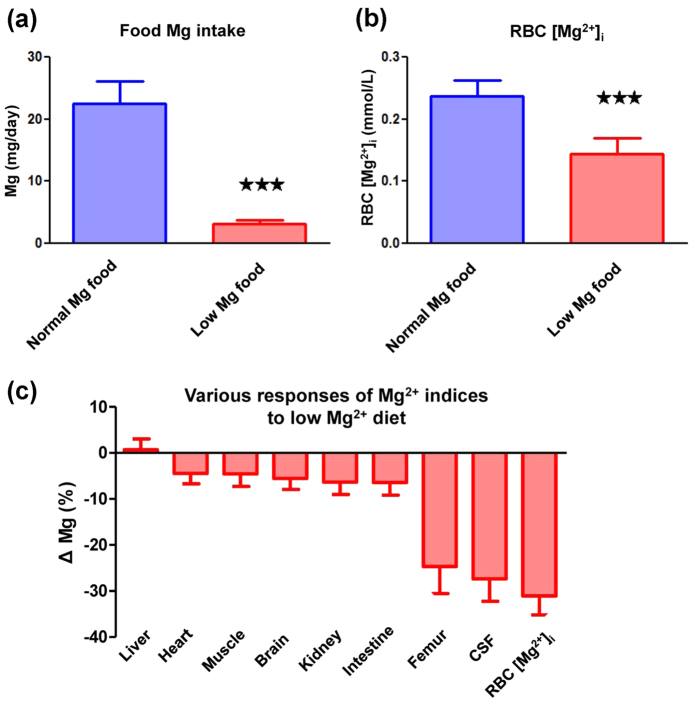
Figure 1. RBC [Mg2+]i indicates body Mg2+ decline.
(a) Daily Mg2+ intake in normal and low Mg2+ diet groups. (b) RBC [Mg2+]i in normal and low Mg2+ diet groups. (c) Percentage changes of Mg (Mg2+ or total Mg) in tissues, cerebrospinal fluid (CSF), and erythrocytes (RBCs) (calculation was described in Equation (1)). Young rats (3 months), n = 10 for each group. Unpaired t test, ***p < 0.001.

