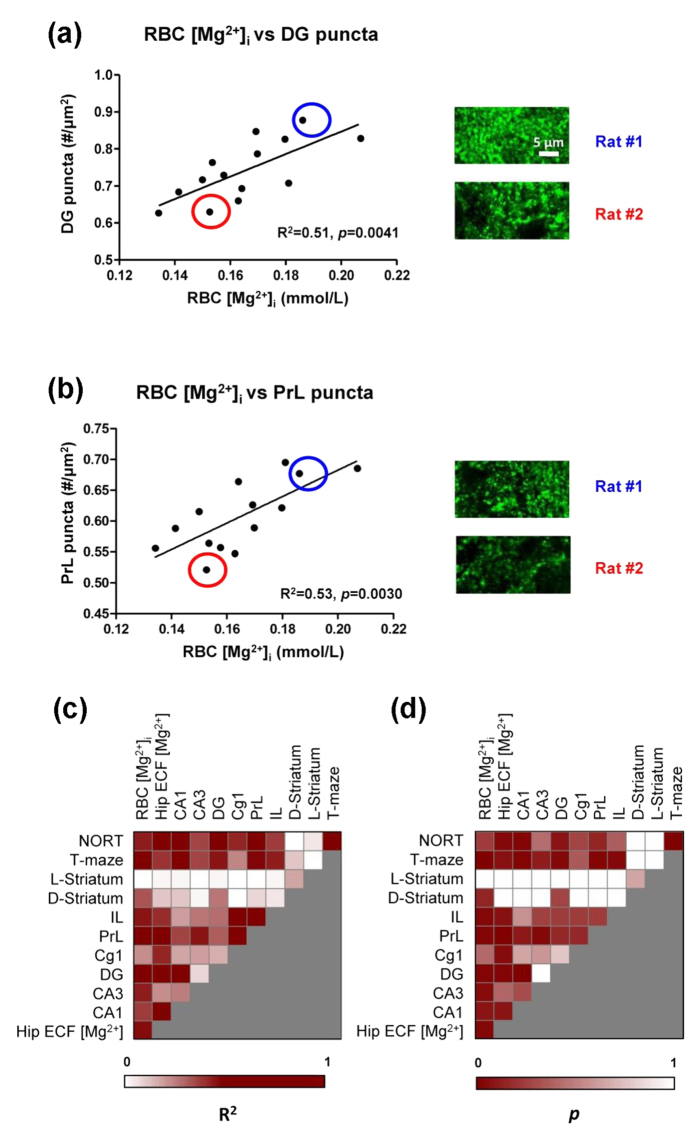
Figure 6. Correlation between RBC [Mg2+]i, Hip ECF [Mg2+] and Syn-(+) punctal density.
(a) Linear correlation between the RBC [Mg2+]i and Syn-(+) puncta density in dentate gyrus (DG) subregion of Hip (aged rats, n = 14). The density was estimated as the number of immunostained puncta per μm2 (#/μm2). Rat #1 (blue circle) and rat #2 (red circle) were selected; their immunostaining images were showed as examples. (b) Linear correlation between the RBC [Mg2+]i and Syn-(+) puncta density in the PrL subregion of the prefrontal cortex (PFC). The immunostaining images of rat #1 and rat #2 were showed as examples. (c,d) Heat maps of linear analysis for [Mg2+], Syn-(+) puncta density, and memory (c, R2; d, p).

