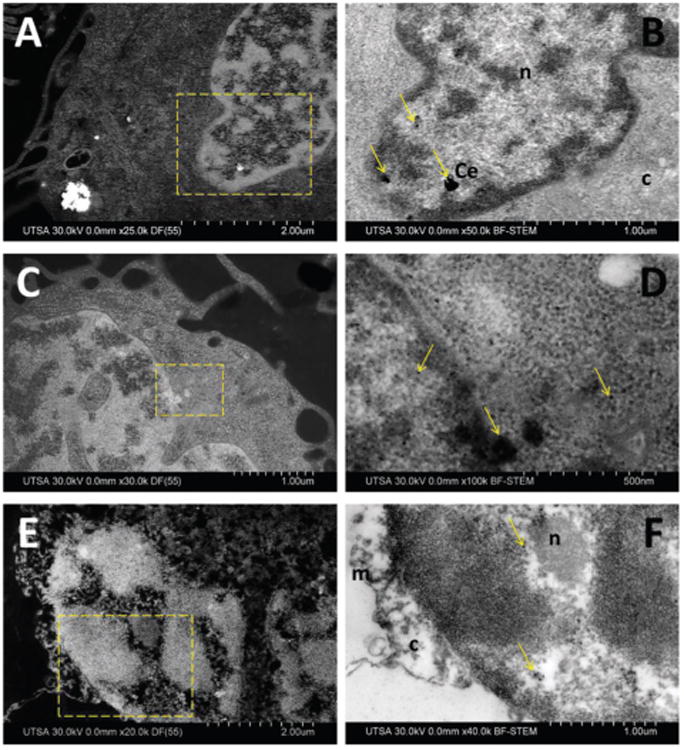
Fig. 8.

Ultrastructural location of nanoparticles into macrophage cells after 24 h. (A) DF-STEM imaging of CeO2. (B) BF-STEM imaging, selected area of (A). (C) DF-STEM imaging of TiO2. (D) BF-STEM imaging, selected area of (C). (E) DF-STEM imaging of ZnO. (F) BF-STEM imaging, selected area of (E). Arrows indicate location of nanoparticles, n (nucleus), c (cytoplasm), m (membrane).
