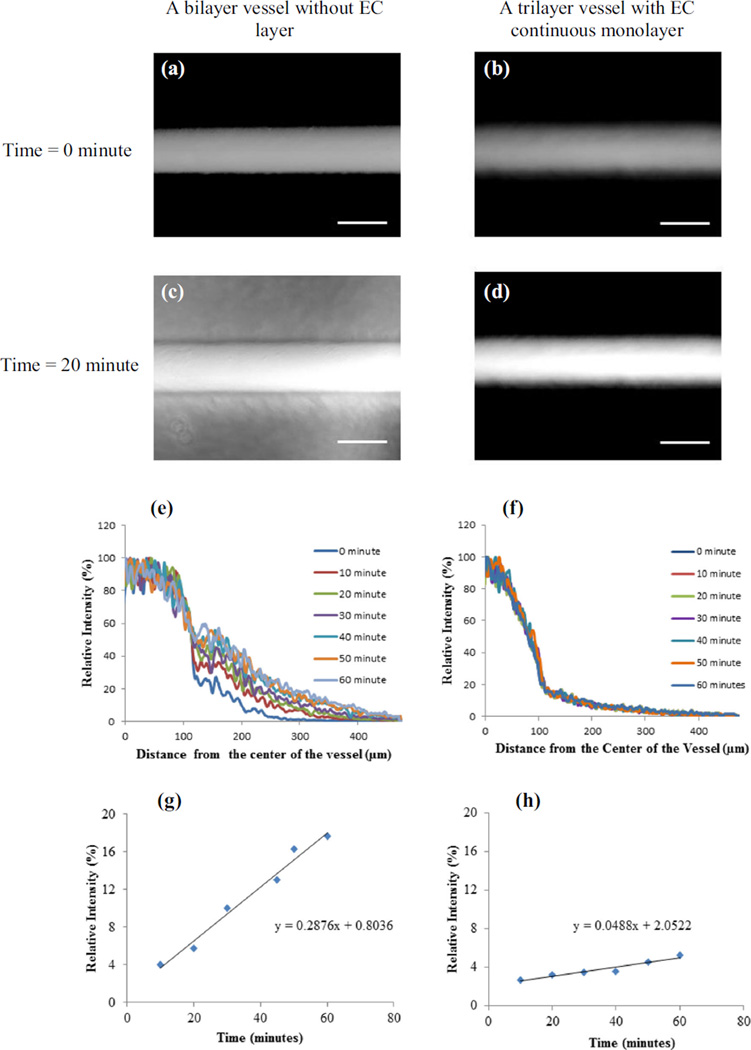
Fig. 5.
Permeability of fluorescently labeled 10 kDA dextran to the walls of. the vessel-like structures from the flow in the lumen: a a vessel without any EC layer at time zero of starting the dextran perfusion, b a vessel with an EC monolayer at time zero of starting perfusion, c a vessel without any EC layer after 20 min of dextran perfusion, d a vessel with an EC monolayer after 20 min of dextran perfusion. e and f Change in relative intensity of fluorescence with respect to the distance from the center of the vessels for the vascular-like structures without and with the EC monolayer respectively. The fluorescent intensity from line scannings across the vessels orthogonal to the axial direction at their center in a and b was measured at a time interval of 10 min. The intensities were then normalized against the maximum intensity values at the center of the vessel. g and h The relative intensity values at a distance 300 µm from the center of the vessels at different time points. The barrier function was obtained from the slope of the relative intensity versus time graphs in g and h. Scale bars = 200 µm

