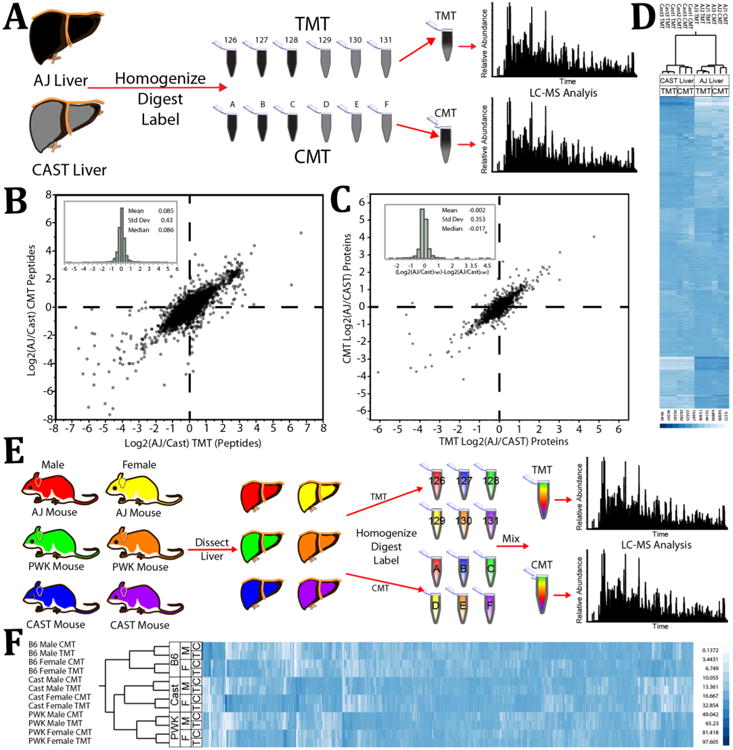
Figure 4.

Protein-level comparison of mixing ratios measured by CMT or TMT of mouse liver tryptic digests derived from male and female mice of three unique strains. (A) Experimental design for data represented in (B), (C), and (D). Livers of two unique mouse strains were homogenized, digested, and labeled with TMT or CMT. Samples were mixed into 6-plexed combinations and analyzed by LC-MS on an Orbitrap Fusion. (B) The average ratio between peptides of the AJ and CAST strains transformed by the log base 2 from the CMT experiment are plotted against those quantified in the TMT experiment. This plot includes only those peptides identified with both labeling systems that displayed a total reporter ion signal/noise greater than 200 (>233 for CMT) and which had an MS2 isolation specificity greater than 0.8. (Inset) Log base 2 fold difference distribution between measurements made in the CMT system vs measurements made with the TMT system. (C) The average ratio between proteins of the AJ and CAST strains transformed by the log base 2 from the CMT experiment are plotted against those quantified in the TMT experiment. (Inset) Log base 2 fold difference distribution between measurements made in the CMT system vs measurements made with the TMT system. (D) Fractional contribution of each sample to the overall signal of each quantified protein in both labeling experiments (CMT and TMT) was compared via hierarchical clustering. (E) Experimental design for data represented in (F). Livers from both male and female mice of three unique strains were homogenized, digested, and labeled with TMT or CMT. Samples were mixed into 6-plexed combinations and analyzed by LC-MS on an Orbitrap Fusion. (F) Fractional contribution of each sample to the overall signal of each quantified protein in both labeling experiments (CMT and TMT) was compared via hierarchical clustering. The PWK and CAST strains are closer to each other evolutionarily than to the B6 strain.
