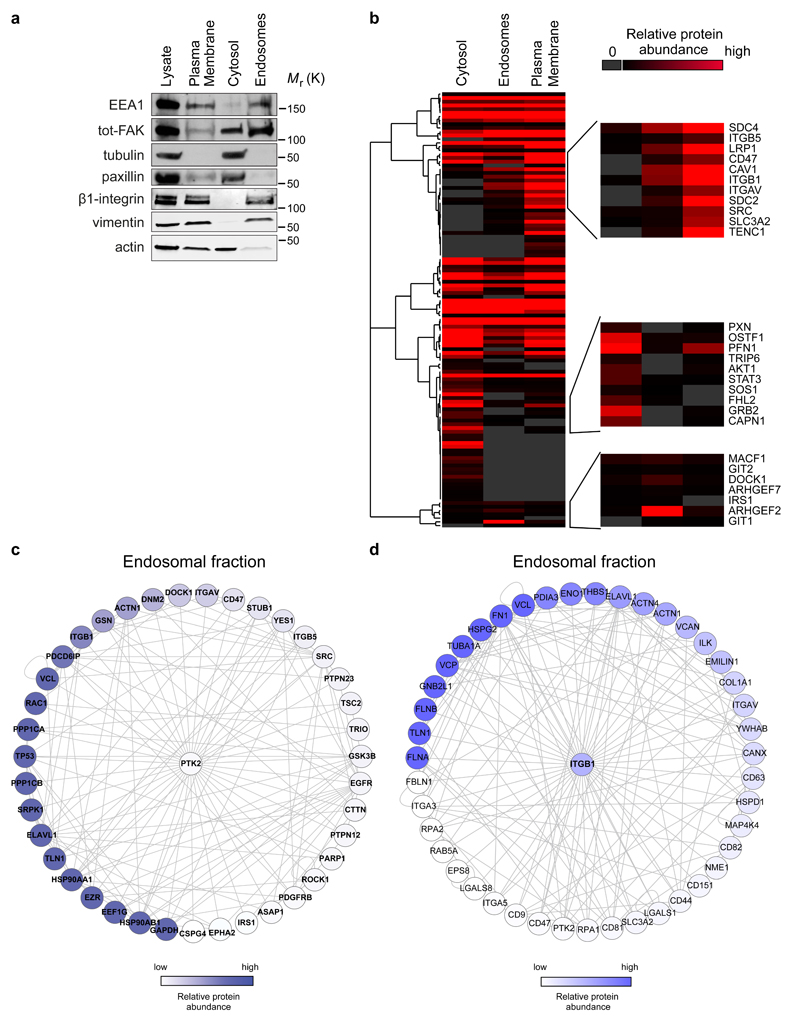
Figure 5. Endosomal proteome.
a, Representative western blot validation of fractionated samples analysed by mass spectrometry. b-d, The threshold for protein identification was set at a minimum of 3 spectral counts with at least 2 unique peptides. Altogether, 2021, 1667 and 2006 proteins were detected in the cytosolic, endosomal and plasma membrane fractions, respectively. b, Hierarchical clustering of Geiger adhesome proteins identified in the cytoplasmic, plasma membrane and endosomal fractions. Examples of proteins detected in multiple clusters are displayed on the right hand side (two independent experiments). c-d, Known FAK (PTK2) (c) and β1-integrin (ITGB1) (d) interacting proteins identified in the mass spectrometric analysis of purified endosomal fractions in FAK +/+ MEFs. Proteins were mapped onto a human protein-protein interaction network. Each node represents a protein (labelled with gene name) and each edge represents a reported interaction between two proteins. The nodes are coloured according to protein abundance (two independent experiments).
Uncropped images of blots are shown in supplementary figure 9.

