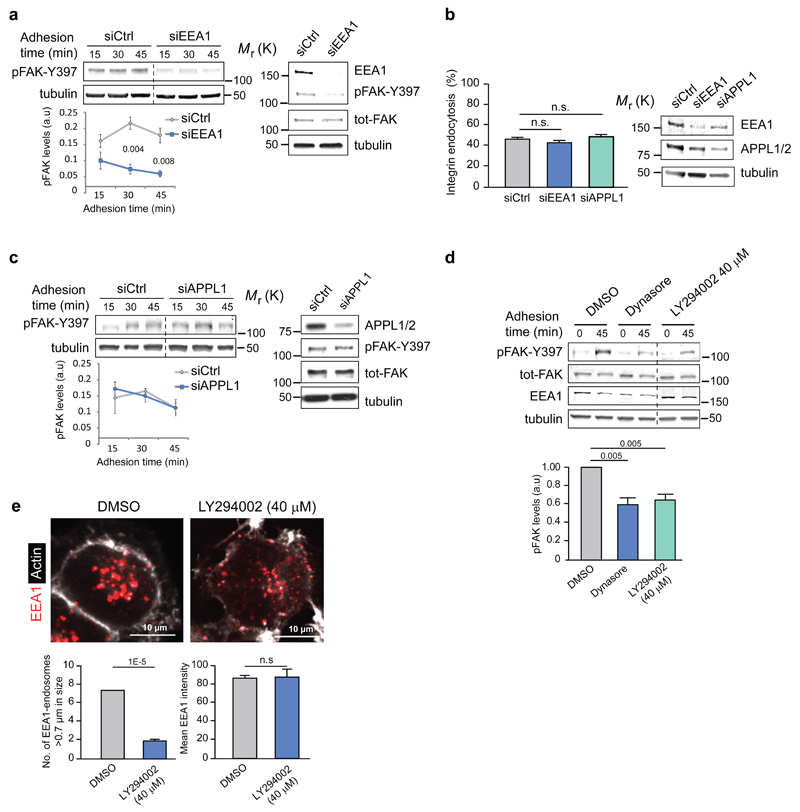
Figure 6. Integrin signalling is EEA-1 dependent.
a, c, Representative blots and quantification of pFAK protein levels following EEA1 (a) or APPL1 (c) silencing in NCI-H460 cells plated on collagen (mean ± SEM, n=3 independent experiments). b, Integrin endocytosis in EEA1- or APPL1-silenced NCI-H460 cells plated on collagen (30 min) using active β1-integrin (9EG7) antibody (proportion of cytoplasmic/total staining, mean ± SEM, n=43 cells pooled from three independent experiments). d, Representative immunoblot and quantification of pFAK protein levels in NCI-H460 cells plated on collagen ± dynasore or PI3K- inhibitor LY294002 (mean ± SEM, n=3 independent experiments). e, Representative confocal images of EEA1 and actin staining in NCI-H460 cells ± PI3K inhibitor (LY294002 40 μM) and quantification of the number of EEA1-endosomes larger than 0.7 μm and the total mean EEA1 intensity (mean ± SEM, n = 16 cells per condition pooled from two independent experiments). Student's two-tailed unpaired t-test P values are provided and statistics source data can be found in Supplementary Table 2. Uncropped images of blots are shown in Supplementary Figure 9.

