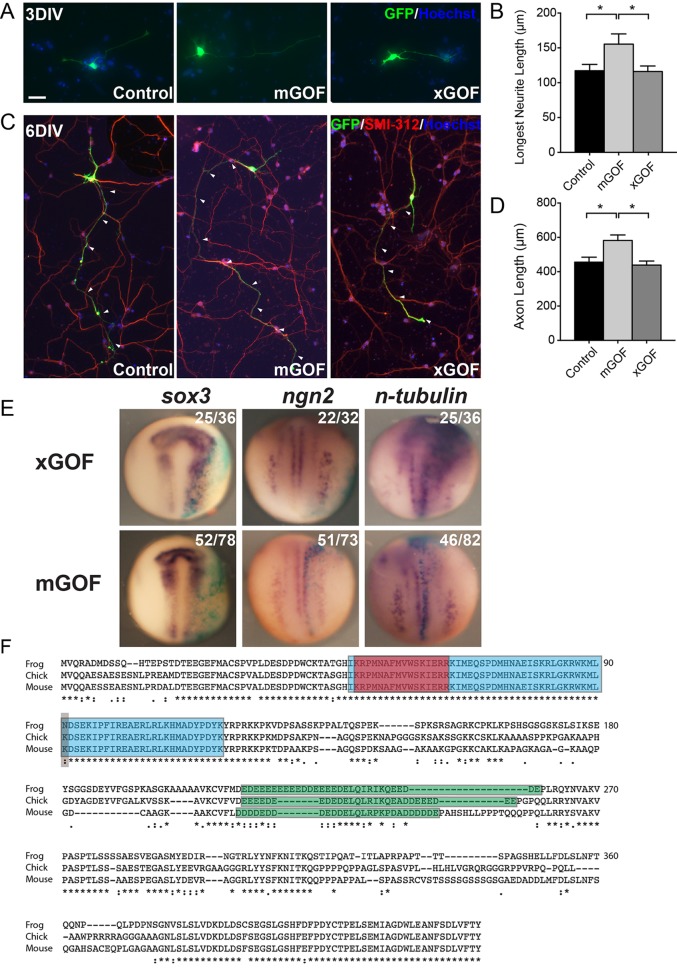
Fig. 5.
Functional reciprocity of Sox11 between frog and mouse. (A-D) Primary cortical neurons expressing GFP alone (left), GFP and mouse Sox11 (mGOF, middle), and GFP and Xenopus sox11 (xGOF, right) and analyzed at 3DIV (A,B) and 6DIV (C,D) revealed increases in the longest neurite (B) and axon (D) when mouse Sox11 but not frog sox11 was expressed. Data represented as mean±sem; *P<0.05. (E) WISH of st. 15 embryos (dorsal view, along with the anterior-posterior axis) injected at the two-cell stage with either frog (top) or mouse (bottom) sox11 and lacZ tracer (blue). xGOF elevated levels of sox3, ngn2 and n-tubulin, while mGOF had no effect. (F) Alignment of frog, chicken and mouse Sox11 protein sequences. Frog sequence shown here is Sox11a sequence: Sox11a and Sox11b share 93% similarity, and the single amino acid difference observed between frog Sox11a and other species is also present in Sox11b sequence. Discrete protein domains are shaded: blue is the HMG box, red is the nuclear localization signal; green is the acid-rich region; grey marks the one amino acid difference in the HMG box. (*=Identical amino acid residues; :=Different but highly conserved amino acid residues;∙=Different but somewhat similar amino acid residues; blank=dissimilar amino acid residues or gap.) Scale bar: 32 μm (A); 84 μm (C).

