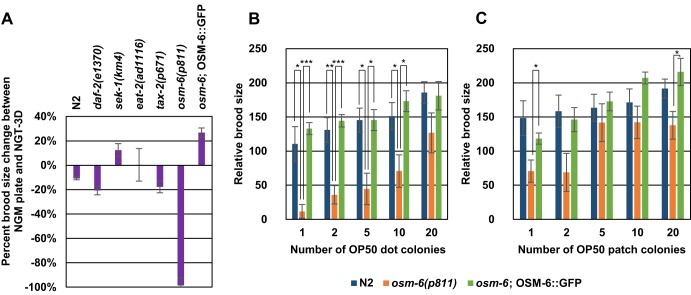
Fig. 3.
Animals defective in osm-6 show compromised brood size in NGT-3D. (A) Percent difference between relative brood size in NGT-3D with more than 40 OP50 colonies and NGM plates is shown for N2 wild-type and several types of mutants. Sample size: N2, n=22; daf-2, n=8; sek-1, n=6, eat-2, n=5; tax-2, n=6; osm-6, n=5; osm-6; OSM-6::GFP, n=6. (B,C) Relative brood size was determined for N2 and osm-6 mutants and osm-6;OSM-6::GFP rescue strain on OP50 dot plates (B) and OP50 patch plates (C) with varying numbers of bacterial colonies. See Materials and methods for explanation of the types of plates. Sample size n=5 for all. Error bars indicate standard error. Significance is calculated by Student's t-test. *P<0.05; **P<0.01; ***P<0.001.

