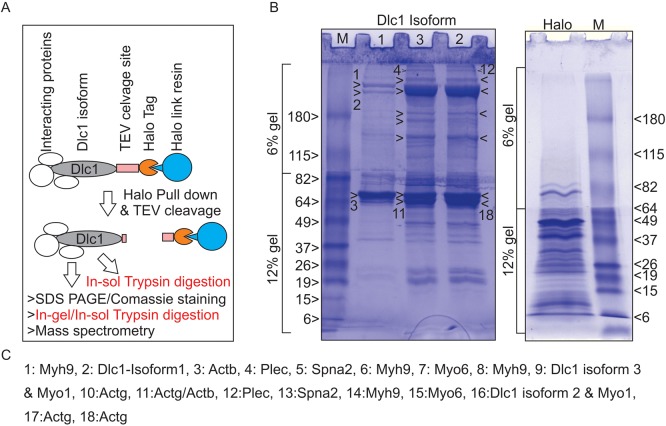
Fig. 1.
Identification of interacting partners of Dlc1 protein. (A) Diagrammatic representation of the Halo-tagged Dlc1 pull-down analysis. (B) Coomassie blue-stained SDS-polyacrylamide gel showing separation of the Dlc1 pull-down products. The excised bands are numbered for in-gel digestion and subsequent mass spectrometry analysis. Only the top and the bottom gel bands have been marked by Arabic numerals due to space constraints. The intervening bands can be counted manually based on the top or bottom number. (C) List of proteins identified by mass spectrometry corresponding to the excised bands shown in the right panel. The proteins correspond to the highest number of peptides found by mass spectrometry.

