Fig. 2.
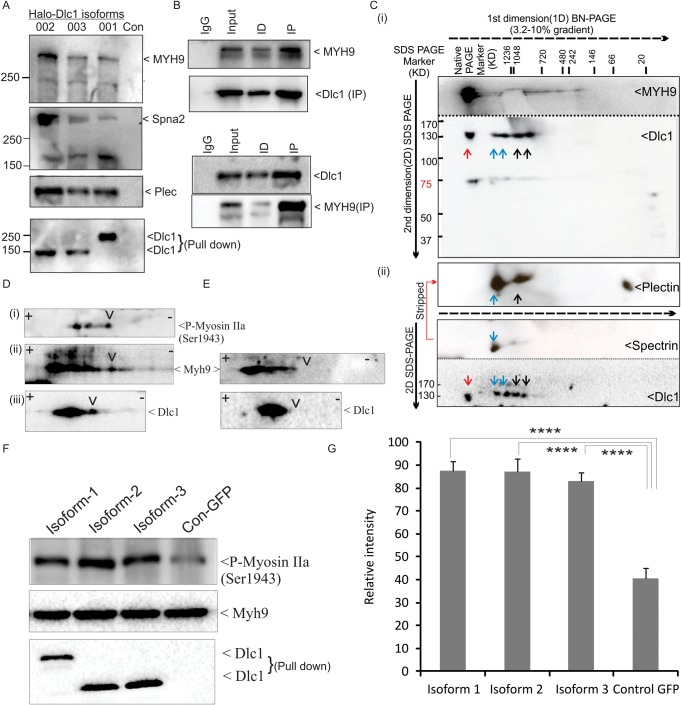
Validation of Dlc1-interacting proteins by co-immunoprecipitation and BN-PAGE. (A) Immunoblot blot shows pull-down of Myh9, Spna2 and Plec along with the three Halo-tagged Dlc1 isoforms transiently transfected in OC-033 cells. Eluted extracts from Halo-resin pull-downs were run on SDS-PAGE and blotted with the indicated antibodies. (B) Reciprocal co-immunoprecipitations of Dlc1 and Myh9 in Bend3 cells. ID-immuno-depleted and IP-immunoprecipitated fractions. (C) Immunoblot after 2D BN-PAGE/SDS-PAGE showing multiprotein complexes containing Dlc1. The cellular lysate from BC 7-2 cells was subjected to 2D BN-PAGE/SDS-PAGE and subsequently immunoblotted with anti-Dlc1, Myh9, Plec and Spectrin antibodies. Samples were run in multiple lanes of a single native gel (dotted black line indicates direction of gel movement) and then individual lanes were dissected and run in 2nd dimension SDS-PAGE (solid black arrow indicates direction of gel movement). (Ci) The top panel is a single blot which was cut into two pieces along the dotted line and immunoblotted separately with anti-Dlc1 and Myh9 antibodies and subsequently imaged together. (Cii) The bottom panel is another blot, cut into two pieces and immunoblotted as described above. The top two panels are stripped membrane (red line showing stripping sequence), the bottom one was first immunoblotted with anti-Spectrin antibody and then stripped and immunoblotted with anti-Plectin antibody and subsequently aligned to show relative position. In 2-D BN-PAGE/SDS-PAGE, the interacting monomeric proteins appear on a vertical line. The MPCs involving different interacting partners are marked by red (Dlc1+Myh9), blue (Dlc1+Plec+Spectrin) and black (Dlc1+Plec) arrowheads. (D) Association of Dlc1 with phosphorylated Myh9 (Ser1943): Halo-taged-Dlc1 pull-down product was cleaved by TEV protease, focussed on a pH 3-10 IEF strip and subsequently resolved by 2D-SDS-PAGE. The left panel immunoblot (Dii) indicates that Dlc1 is associated with multiple post-translationally modified forms of Myh9 (black arrowheads), specifically Myh9 phosphorylated at residue Ser-1943 (Di). (E) The immunoblots were obtained following phosphatase treatment of the halo pull-down products. Arrowheads indicate the position of missing phosphorylated bands. (F) Immunoblots indicate relative proportion of p-Myh9 (Ser1943) in cells overexpressing the different Dlc1 isoforms. (G) Bar diagram showing relative quantification of p-Myh9 (Ser1943) in cells overexpressing the Dlc1 isoforms. Data are expressed as the mean±s.d. of 4 independent experiments. ****P<0.001 as calculated by Mann–Whitney test.

