Fig. 4.
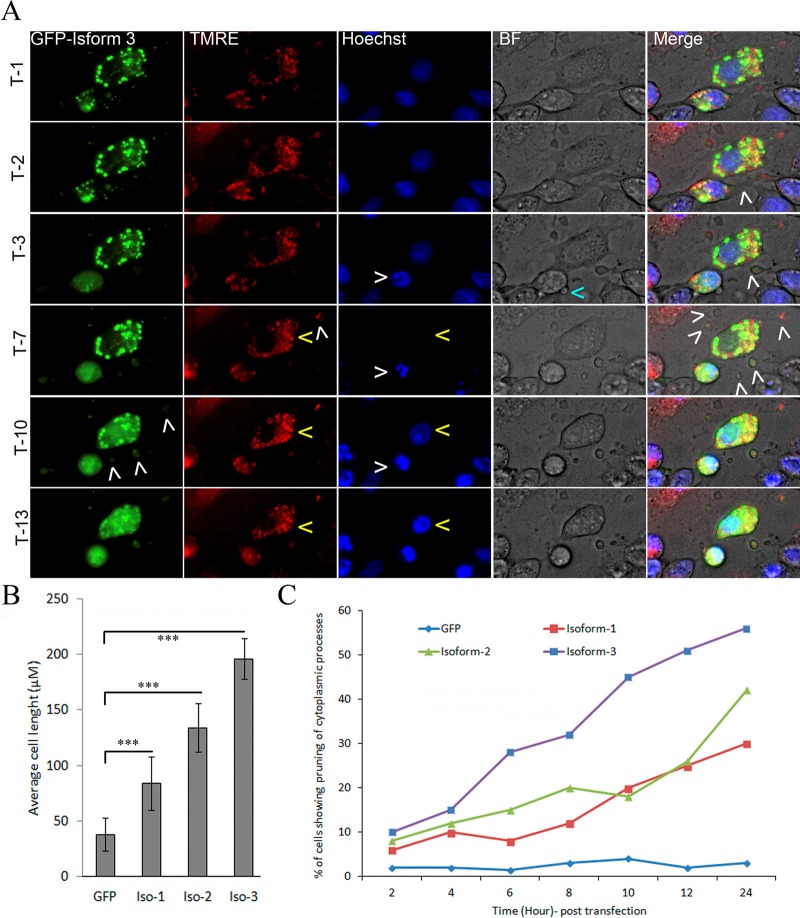
Effect of Dlc1 isoforms on cell morphology. (A) Time lapse (every 5 min) images of cells starting at 12 h post transfection with GFP-Dlc1 isoform 3 and stained with tetramethylrhodamine (TMRM) dye. Transfected cells showing extensive cell elongation as well as the tearing off of cytoplasmic processes (white arrowhead on green and merge channels). TMRM and Hoechst dye were used to visualize the integrity of the mitochondria and nucleus, respectively (yellow arrowheads). Apoptotic cells showing reduction of TMRM dye due to loss of mitochondrial membrane potential. T=time unit or time point following 12 h post transfection, each time unit is 5 min in duration. (B) Bar diagram showing average cell length in the transfected cells (mean±s.e.m.). ***P<0.0001 by Mann–Whitney test; when means were compared by one-way ANOVA, P<0.001. (C) The percentage of cells showing extended cytoplasmic processes (>150 µm) over time after transfection of the Dlc1 isoforms. Approximately 400 cells were counted in three independent experiments and the results are represented as the average percent. The mean percentage of cells showing extended cytoplasmic processes was compared at different time points between the GFP-tagged isoforms and the control GFP transfection by two-way ANOVA test. The two-way ANOVA test result indicates that the percentage of cells showing extended cytoplasm process at different time points is highly significant (P=0.0015). It also indicates that there is a significant difference between isoform 3 and isoforms 1 and 2 (P<0.001).

