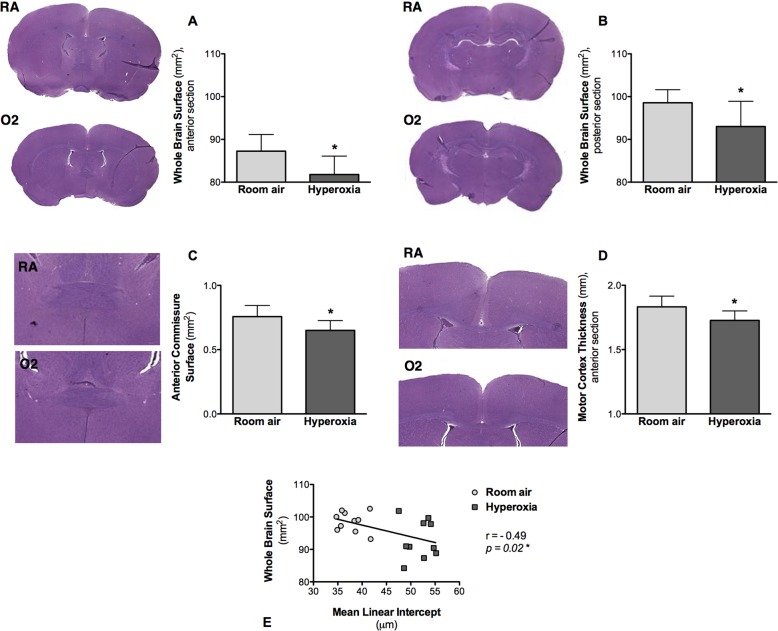
Fig. 3.
Hematoxylin and eosin-stained coronal brain sections of P28 old rats exposed to room air (‘control’ group) or hyperoxia (‘BPD’ group) from P4 to P14. (A-D) Representative coronal brain sections and measurements of different brain structures. (A) Whole-brain surface measured on the anterior sections. (B) Whole-brain surface measured on the posterior sections. (C) Surface of the anterior commissure measured on the anterior sections. (D) Thickness of the cortex measured on the anterior sections from the horn of the corpus callosum to the outer limit of the brain, parallel to the midline. Data represented as mean±s.d.; *P<0.05, in the oxygen-exposed (O2) rat pups, compared to the room air-exposed (RA) rat pups. (E) Comparison between the whole-brain surface measured on the posterior sections (reflecting brain structure) and the mean linear intercept (reflecting lung alveolar structure), showing a negative correlation between both structures (r=−0.49, P=0.02).

