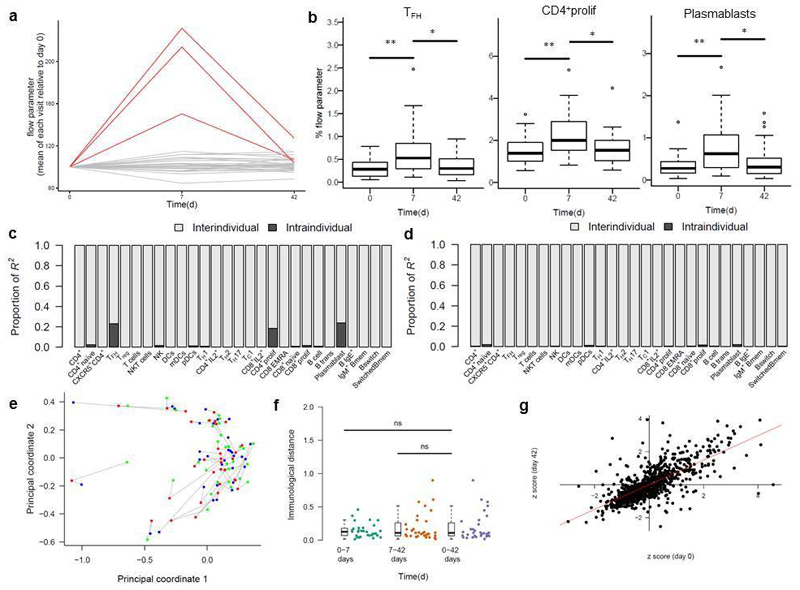
Figure 3.
Immunologial equilibria demonstrate elasticity following influenza vaccination. In a parallel cohort of 32 English individuals, volunteers were sampled prior to vaccination, with follow-up samples at day 7 and day 42 post-vaccination. (a) Samples were phenotyped, normalised to the day 0 value and assessed for change using paired t-tests. Unchanged variables are shown in grey, significantly modified variables are shown in red, with (b) boxplots for each significant immune parameter. Each parameter is labeled on the graph with an (uncorrected, two tailed) paired t-test P value. Boxes show median and interquartile ranges (IQRs), whiskers extend to 1.5 x IQR. (c) A linear model was made for each immune parameter based on the multiple samples from each individual (ANOVA model: immune parameter ~ subject identifier + visit number). For each parameter the proportion of the R2 values from all volunteers attributable to either inter-individual differences or intra-individual differences was assessed for day 0 and 7 or (d) day 0 and 42. (e) Multidimensional scaling of the vaccination time-points. Each individual is represented at day 0 (green), 7 (red) and 42 (blue) and linked by a grey line indicating immunological distance (32 individuals; 96 visits). (f) Quantification of the immunological distance between day 0 and 7, 7 and 42, and 0 and 42 for each volunteer (n=32), with paired t-test. (g) For each volunteer, a Z-score was calculated for each parameter at day 0 and 42, indicating standard deviations from the mean value. Correlation analysis indicates the line of best fit. *, p<0.001; **,p<0.0001.

