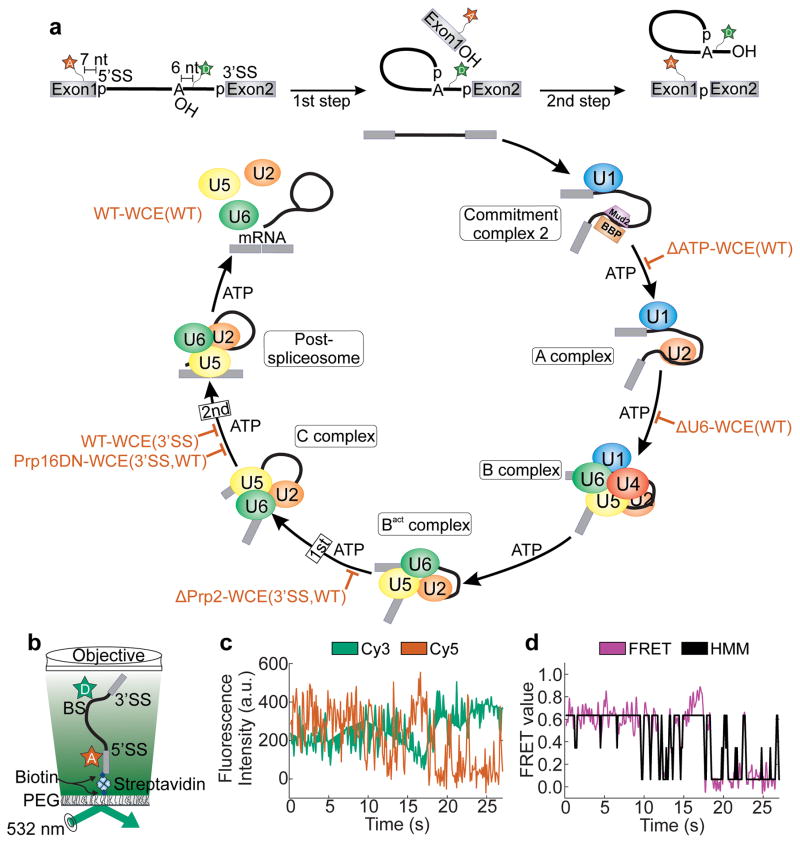
Figure 1.
smFRET analysis of pre-mRNA splicing using the hidden Markov model. (a) The fluorescent substrate used to monitor pre-mRNA dynamics contains Cy5 and Cy3 fluorophores seven nucleotides upstream of the 5’SS and six nucleotides downstream of the BP, respectively. The spliceosome assembly and catalysis pathway is thought to progress in a stepwise manner requiring ATP at several steps of assembly. The biochemical and genetic stalls utilized in this study are indicated by red blocks. (b) Prism-based TIRFM setup for smFRET. (c) Raw single molecule time trace showing the anti-correlated donor (green) and acceptor (red) intensities. (d) The corresponding FRET trace (magenta) and the HMM trace as assigned by vbFRET (black).

