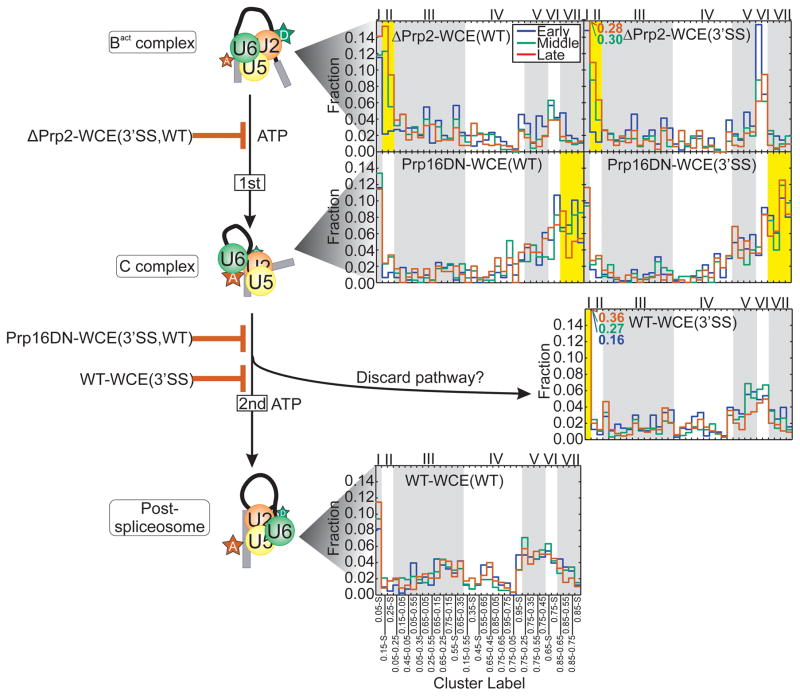
Figure 5.
Cluster occupancy histogram showing the raw fraction of molecules occupying each cluster for the late assembly stages of the splicing cycle. Alternating gray and white backgrounds demarcate the clusters (bottom) comprising each of the 7 clades (top). Clusters of occupancy characteristic of a specified condition are highlighted in yellow.

