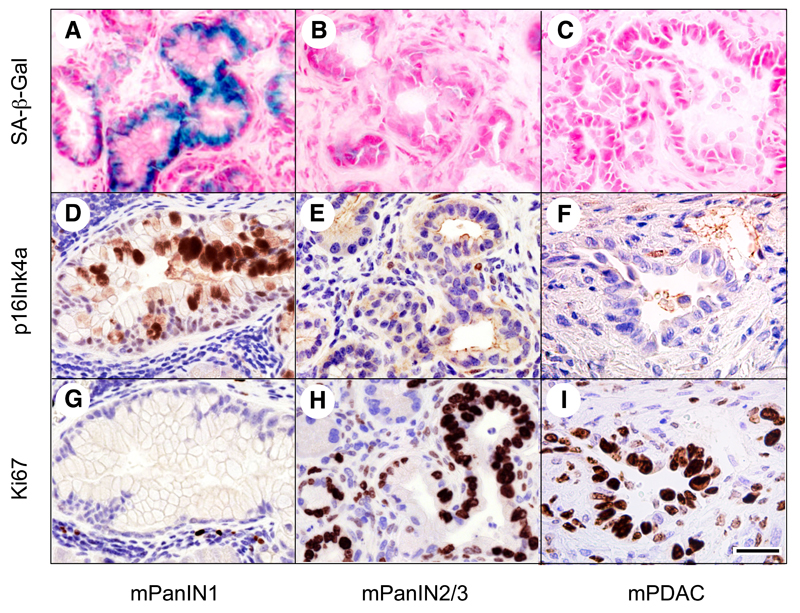
Figure 5. Senescence markers are a feature of low-grade mPanINs, but disappear in high-grade mPanIN2/3 and mPDAC.
(A-C) Senescence associated β-galactosidase (SA-β-Gal) staining (blue) in (A) low-grade mPanIN1 but not in (B) high-grade mPanIN2/3 or (C) mPDAC.
(D-F) p16Ink4a immunostaining (brown) in (D) low-grade mPanIN1 but not in (E) high-grade mPanIN2/3 or (F) mPDAC.
(G-I) Ki67 immunostaining (brown) inversely correlates with the expression of the above senescence markers. Ki67 is detected in a low percentage of cells of low-grade mPanIN1 (G) and in a high percentage of cells of high-grade mPanIN2/3 (H) and mPDAC (I).
Note that panels D-G, E-H and F-I correspond to serial sections. Scale bar represents 50 μm.
See also Figure S4.

