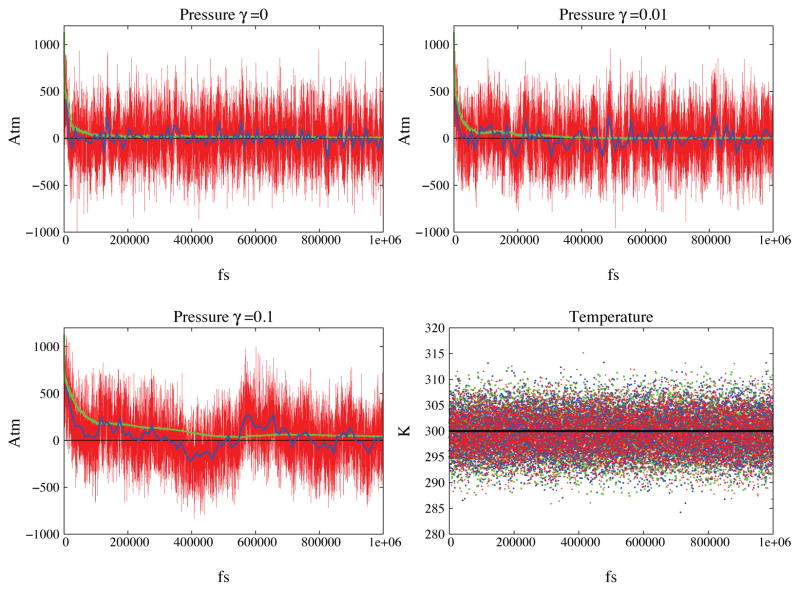
Figure 5.
Simulation of a water box under constant pressure conditions. Pressure and temperature are shown for 3 values of the friction constant 0, 0.01 and 0.1. Panels A, B and C show the instantaneous value of the pressure in red. The blue line indicates the value of the pressure averaged over 10 ps windows while the green line indicates the running average. The black horizontal line is the target pressure. Convergence to the target pressure is evident in all the runs. Panel D shows the temperature as a function of time for the three simulations: green correspond to friction coefficient γ equal to 0 and blue and red to 0.01 and 0.1 respectively. Once again, the horizontal black line indicates the target temperature.

