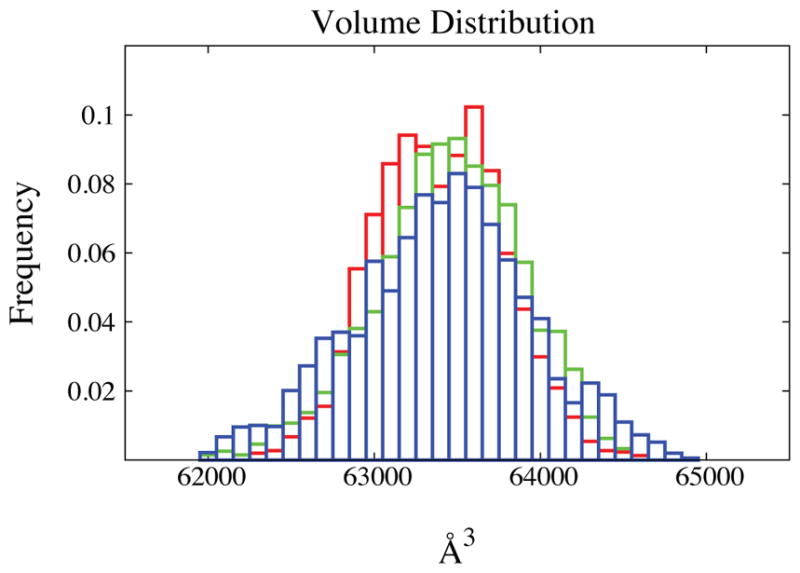
Figure 6.

Volume distribution for the water box (see text for details). Histograms are reported histogram for the three different simulations: green bins are the results of the the deterministic simulations, blue and red are results of simulations with friction coefficients of 0.01 and 0.1 respectively. The three simulations with different level of stochasticity converge to the same average volume and share the similar distributions for the volume variable.
