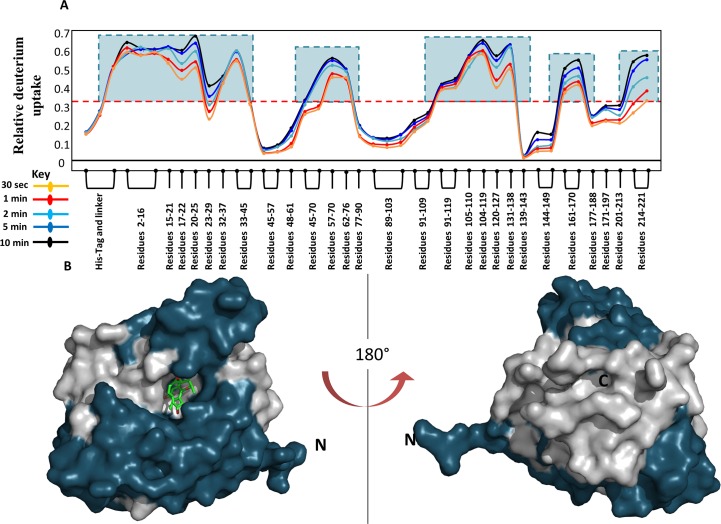
Fig 2.
(A) A modified mirror plot of relative deuterium uptake values (y-axis) for every pepsin digest peptide analyzed, listed from the N to C terminus (x-axis) of Hsp90 for each time point of deuterium exchange. Reporter Regions were determined according to Eq 1 and boxed in teal. (B, C) Regions showing high dynamics were mapped onto the surface representation of Hsp90 (PDB Id: 4EGK) in blue bound to Radicicol (green sticks).

