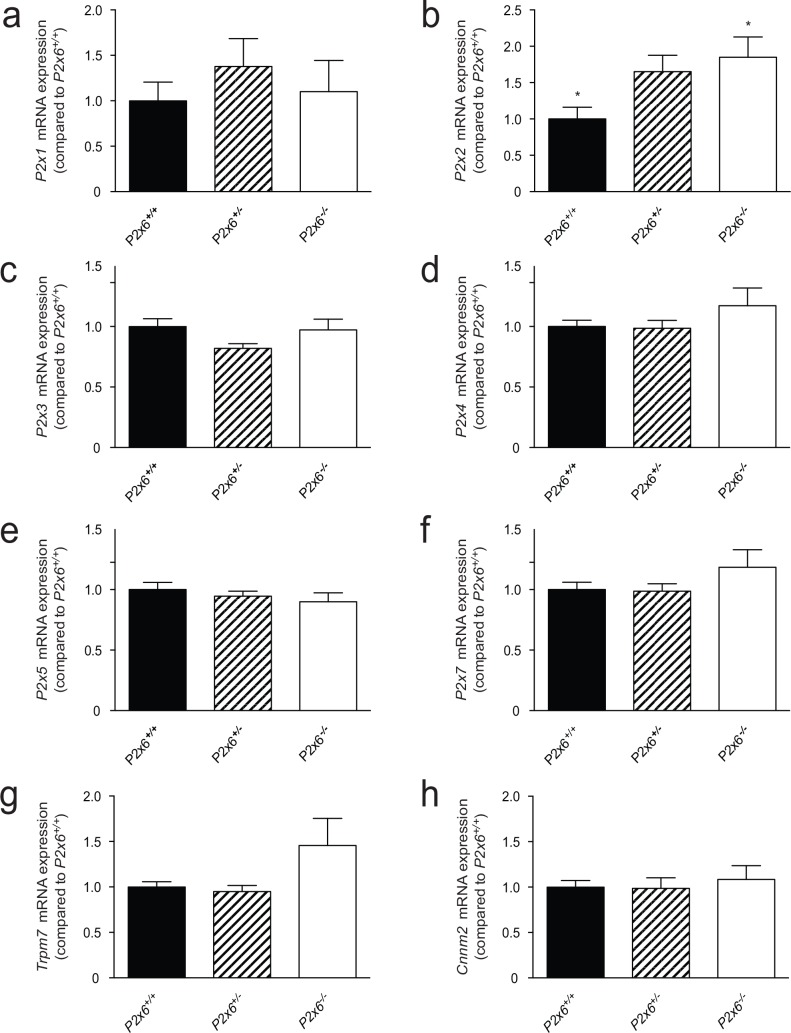
Fig 7. Compensatory mechanisms for the loss of P2x6 function in the heart.
a-h) The mRNA expression levels of P2x1 (a), P2x2 (b), P2x3 (c), P2x4 (d), P2x5 (e), P2x7 (f), Trpm7 (g), Cnnm2 (h), in heart of P2x6+/+ (Black bars), P2x6+/- (Striped bars), P2x6-/- (white bars) mice were measured by quantitative RT-qPCR and normalized for Gapdh expression. Data represent mean (n = 10) ± SEM and are expressed as the fold difference when compared to the expression in P2x6+/+ mice. * P< 0.05 indicates a significant difference from P2x6+/+ mice.

