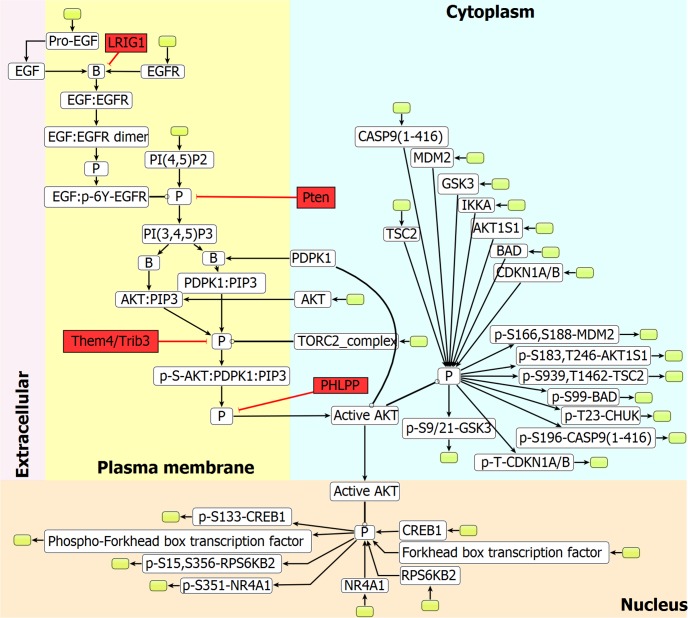
Fig 2. Sub-network of EGFR_SN network.
A part of the EGFR signaling network representing AKT signaling. Nodes indicate the reacting component and edges denote the reactions. Red nodes indicate inhibitors which were manually added to the model in the form of GPRs (information obtained from the Reactome database), white nodes indicate signaling components present in the original SBML file downloaded from the Reactome database and green nodes indicate exchange reactions which were added to the model to remove dead ends. Node ‘B’ and ‘P’ indicates binding, and phosphorylation, respectively. Edges: → transition, ⟞ inhibition, ⫯ catalysis.

