
Fig 6. Proliferation rate and glycolytic activity are higher in D492 than in D492M cells.
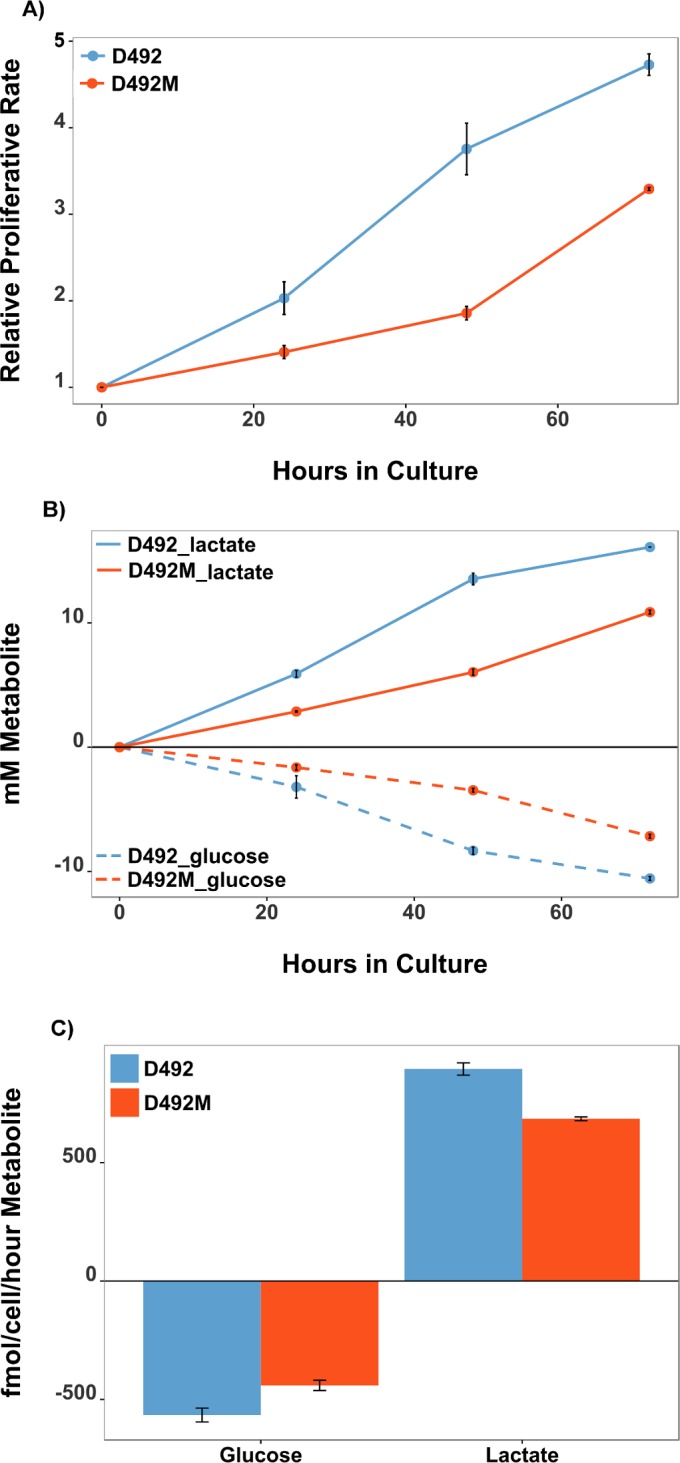
A) Cell proliferation assay demonstrated a higher growth rate of D492 cells compared to D492M cells. B) Spent medium analysis of glucose (dashed lines) and lactate (solid lines) shows higher glucose uptake and lactate secretion in D492 cells (blue) than in D492M cells (red). C) Calculated glucose uptake and lactate secretion rates indicate higher glycolytic flux rates per cell per hour in D492 cells than D492M cells. Data represents results from 3 independent experiments. Error bars represent standard deviation in a single experiment done in triplicate. mM: milli molar, fmol: femto molar.