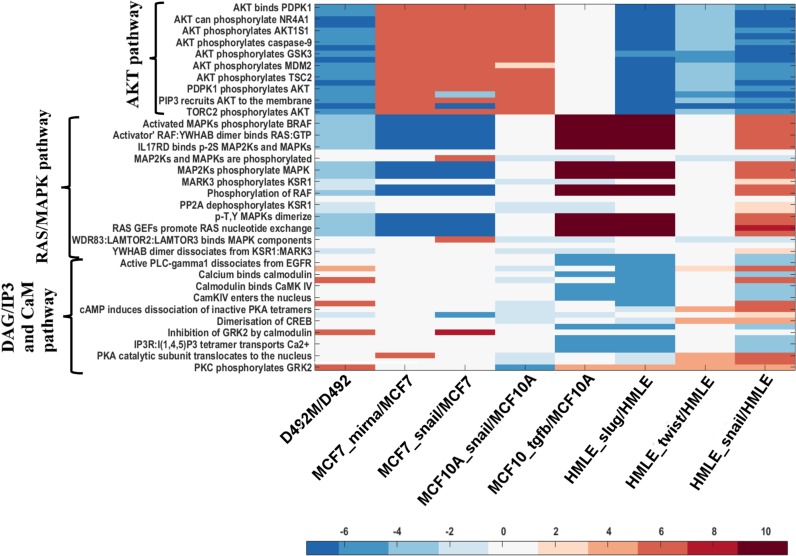
Fig 7. Comparison of flux distribution in the reactions within AKT, RAS and CaM pathway in different breast epithelial cell lines.
The heat map has been generated using log2 relative mean flux of the reactions within the AKT, RAS and DAG/IP3 and CaM pathways in epithelial and mesenchymal cells of D492, MCF, MCF10A and HMLE cells. Exchange reactions are not included in the heat map. The negative and positive values as depicted on the color scale denote higher flux in reactions of epithelial and mesenchymal cells, respectively. D492M, MCF7_mirna, MCF7_snail, MCF10_snail, MCF10A_tgfb, HMLE_slug, HMLE_twist and HMLE_snail are EMT derived mesenchymal cells.

