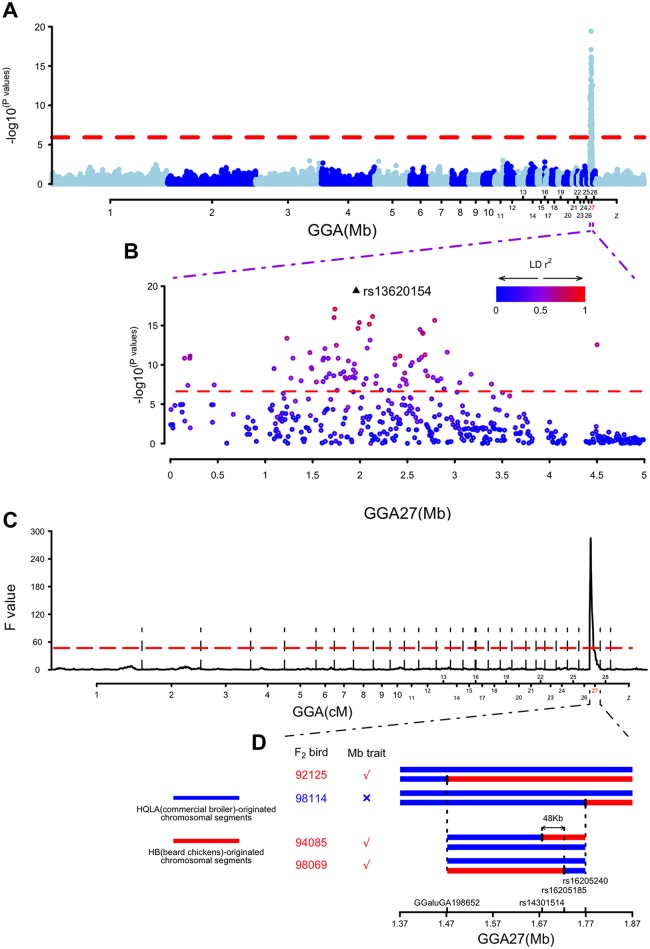
Fig 2. Results from the Genome-Wide Association, linkage and shared IBD analyses on the Muffs and beard (Mb) trait in HB × HQLA population.
(A) The Manhattan plot from the Genome-wide association analysis for the Mb phenotype at 10 weeks of age. X-axis shows the physical positions in Mb for each marker along the chromosomes, and the y-axis shows -log10 p values for the association tests. (B) A scatter plot illustrating all SNPs tested on GGA27 for the Mb trait at 10 weeks of age. The peak SNP (rs13620154 on GGA27 at 1,959,687 bp) is marked with a filled triangle, while other SNPs are marked with dots. The colors of the dots indicate their LD (r2) with the peak SNP. (C) The whole-genome linkage analysis for the Mb trait at 10 weeks of age. The x-axis shows the genetic positions in centiMorgan (cM) along chromosomes, and the y-axis shows the F values for each position. Vertical dashed lines are used to distinguish the chromosomes. (D) Shared IBD analysis is shown in schematic form in this plot. Each bar represents the Mb locus identified in linkage analysis for one F2 bird. Bars in red refers to chromosomal segments originated from line HB, bars in blue refers to segments originated from line HQLA. Four breakpoints of recombination were indicated by the corresponding SNP names on the x-axis. The dashed lines indicated the boundary defined by corresponding recombinant individuals. The arrows pointed out the location of the final fine-mapped 48-kb interval between two SNPs (rs14301514 and rs16205185).

