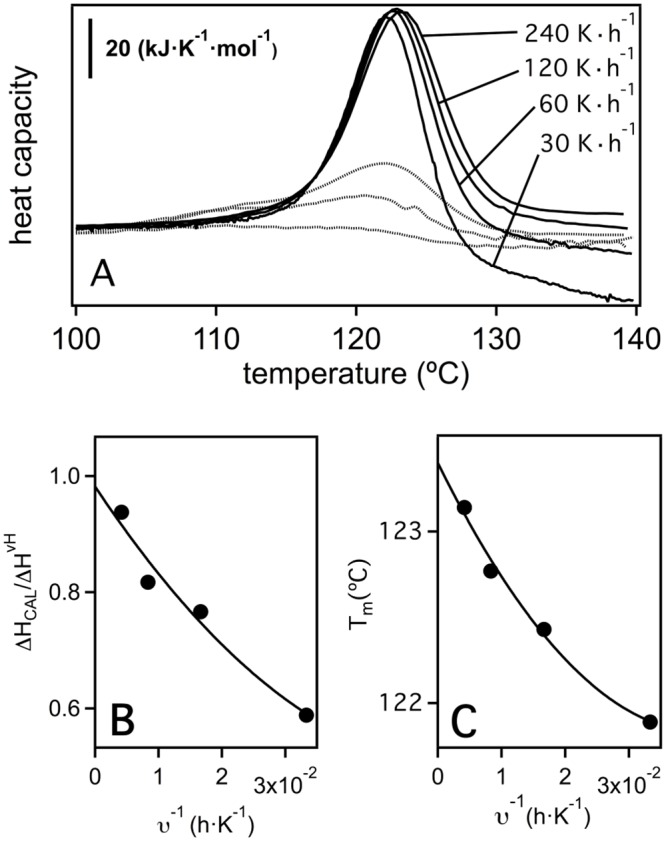
Fig 8. Thermal denaturation of the laboratory representation of the thioredoxin corresponding to the LPBCA node (see Fig 1) as determined by differential scanning calorimetry (DSC).

(A) DSC profiles for LPBCA denaturation at several scan rates. Dotted lines represent the profiles obtained in the reheating runs of the experiments at 240, 120 and 60 degrees per hour. (B) Plot of calorimetric to van’t Hoff enthalpy ratio versus one over scan rate. (C) Plot of denaturation temperature (defined here as that corresponding to the maximum of the heat capacity profile) versus one over scan rate. The lines in panels B and C are the best fits of second-order polynomials and are used to extrapolate to infinite scan rate (1/v = 0).
