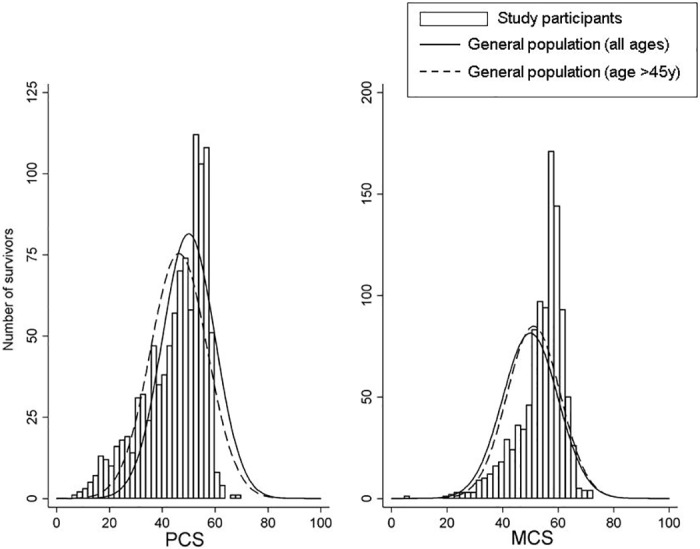
Fig 1. Distribution of Physical Component Summary (PCS) and Mental Component Summary (MCS) scores among survivors (black bars; bin width is 2 units), and normative reference populations.

Solid line represents the US general population, with normal distribution with mean (standard deviation) of 50 (10). Dashed line represents the US population over age 45 years, with mean PCS 46.3 (10.8) and mean MCS 51.1 (9.6)[14, 15, 33]. Curves have been scaled such that the area under each is equal to the number of participants, 1,021, and the y-axis is the number of survivors in each bar.
