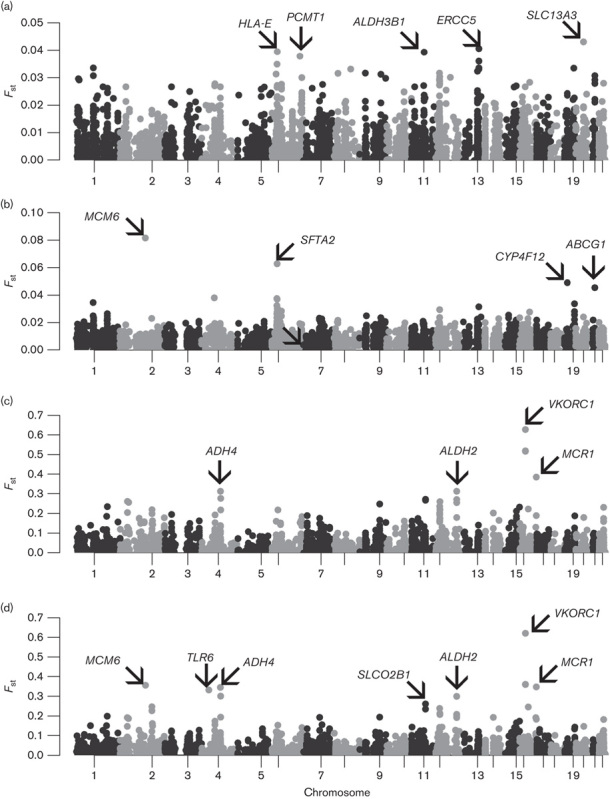
Fig. 5.

‘Manhattan’ plots of FST between the main population groups. Plots of FST for 5139 SNPs for comparisons across (a) only SL populations, (b) SL and SAS populations, (c) SL and SGVP populations, and (d) all populations, by chromosome and position. Genes in which SNPs with the highest FST reside are also indicated. SAS, South Asian; SGVP, Singapore Genome Variation Project; SL, Sri Lankan; SNP, single nucleotide polymorphism.
