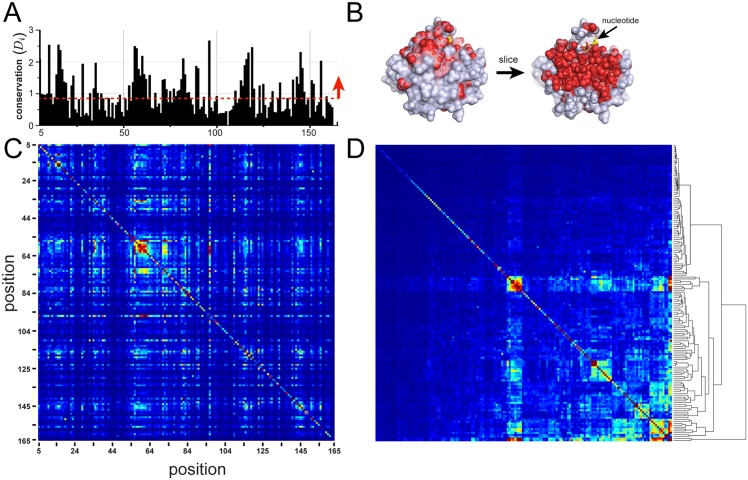
Fig 3. Positional conservation (Di) and the SCA weighted correlation matrix for the G protein family.
A-B, The overall positional conservation Di for the G protein alignment, and a corresponding mapping on a slice through the core of the atomic structure of a representative member of the family (human Ras, PDB 5P21). The data show that the top 50% of conserved positions (in red) lie at functional surfaces and within the solvent inaccessible core. Thus, positional conservation maps to an intuitive and a well-known decomposition of protein structures. C-D, ordered by primary structure (C), and after hierarchical clustering (D). The data describe a sparse and seemingly hierarchical organization of correlations—a general result for most protein families.

